This article originally appeared on climate.gov
Earlier this spring, NOAA released the 1991-2020 U.S. Climate Normals—the new official baseline for describing average U.S. climate. Climate.gov produced a collection of maps showing how what counts as “normal” temperature and precipitation for the United States has changed over the past century. Now we’ve doubled back to make maps not of change, but simply the new annual average temperature and precipitation across the contiguous United States.
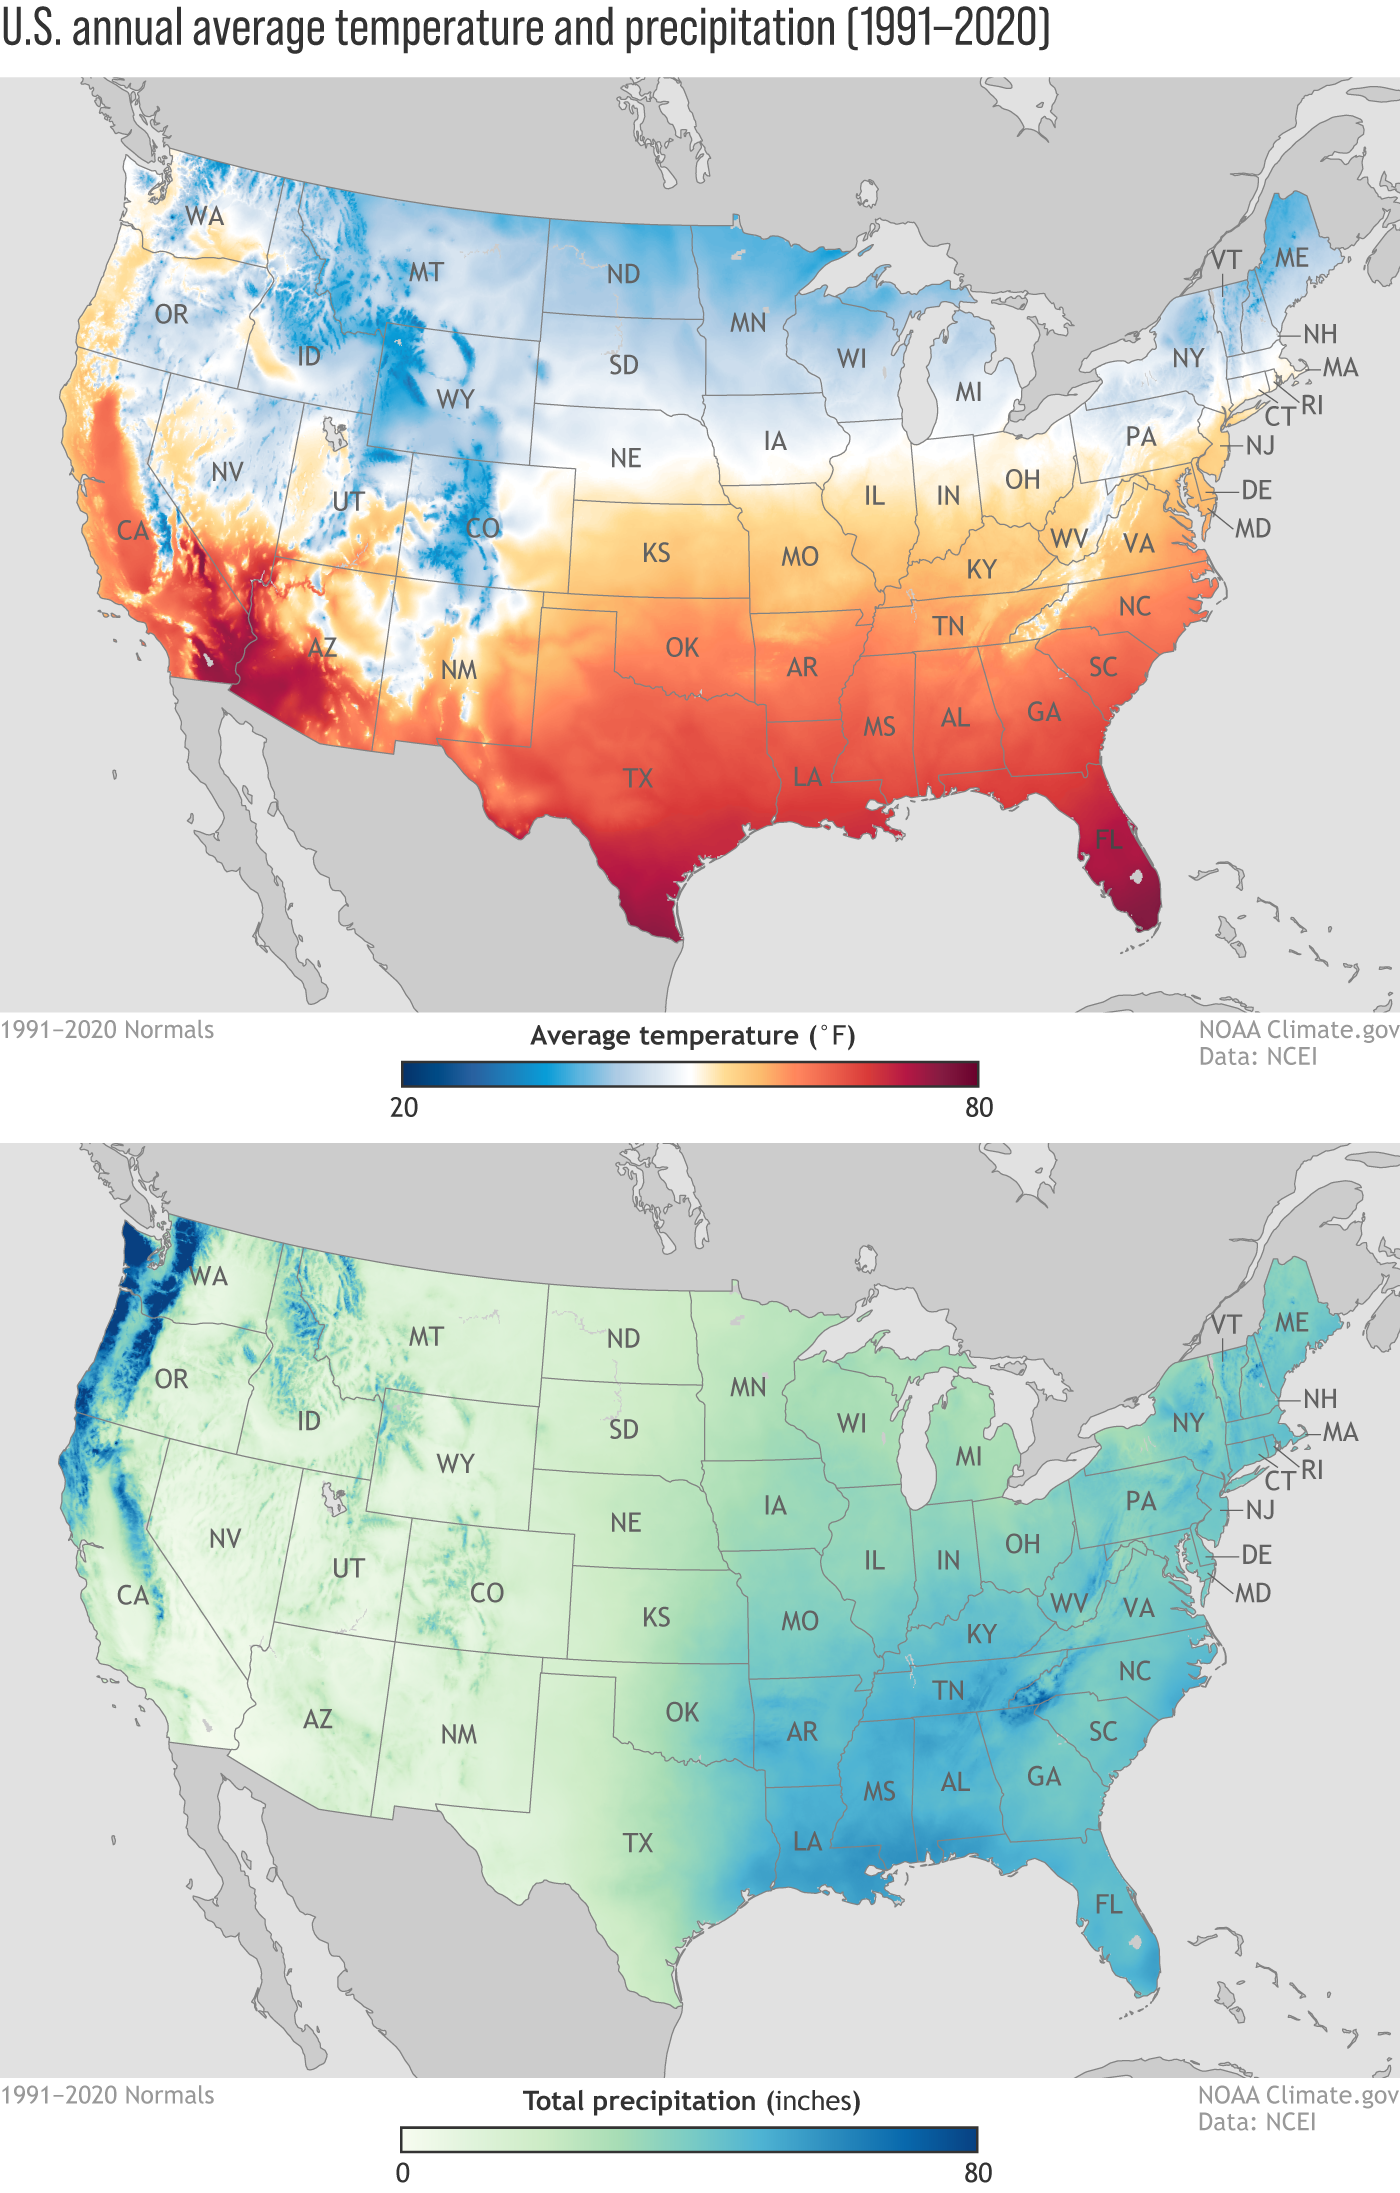
These maps show annual average temperature and precipitation for the Lower 48 U.S. states based on observations collected at thousands of U.S. weather stations from 1991–2021. (Normals are available for individual weather stations in Alaska and Hawaii.) On the temperature map (top), places where the annual average temperature is around 50 degrees Fahrenheit are white. Colder areas are blue. Warmer areas are orange and red. On the precipitation map (bottom), the wettest parts of the country, where the annual average precipitation is close to 80 inches a year or more, are dark blue. The driest parts of the country are light green. (“Binned” versions of these maps are also available for download below the main image.)
The contiguous United States has a big range of climates and microclimates. The southernmost parts of Florida, Texas, California, and Arizona all have annual average temperatures of at least 70 degrees, but very different rainfall amounts: 10 inches or less in the Southwest versus more than 50 inches in Florida. Parts of the Dakotas are as dry as New Mexico on an annual average basis, and yet at first glance, they don’t seem nearly so arid, in part because they are also much cooler.
Everywhere they occur, mountains—even just isolated ridges and plateaus—are wetter than their surrounding lowlands. The contrast is most extreme in Washington and Oregon, where the Coast and Cascade Ranges in the west are up to 8 times wetter than parts of the Columbia River Plateau to the east. Less dramatic contrasts outline the local ranges of the Appalachian Mountains that run North to South in the East: New Hampshire’s White Mountains, West Virginia’s Alleghenies, and the Great Smokey Mountains at the intersection of North Carolina, South Carolina, and Georgia.
- To find station data or see how the 1991-2020 Normals compare to the 1981-2010 Normals, visit the U.S. Climate Normals page at the National Centers for Environmental Information.
- To build your own U.S. maps, visit the NOAA Northeast Regional Climate Center’s Gridded Normals Mapper. (Chose the “Region” radio button and then “CONUS” from the dropdown menu.)
- To see how the Normals have changed over the twentieth century, see our story Climate change and the U.S. Normals.