This post first appeared on the climate.gov ENSO Blog and was written by Emily Becker
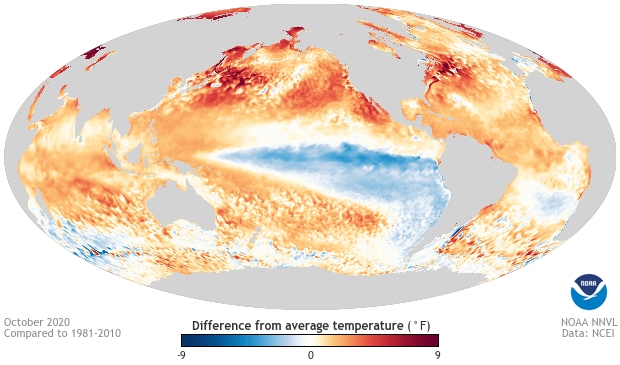
La Niña strengthened over October, with both the tropical Pacific Ocean and the atmosphere clearly reflecting La Niña conditions. Forecasters estimate at least a 95% chance La Niña will last through the winter, with a 65% chance of it hanging on through the spring.
The October sea surface temperature anomaly (departure from the long-term average) in the Niño 3.4 region of tropical Pacific was -1.3°C according to the ERSSTv5 dataset, substantially cooler than the La Niña threshold of -0.5°C. This is the eighth-strongest negative October value in the ERSSTv5 record, which dates back to 1950. I’ll talk more about feats of strength (vis-à-vis La Niña, that is) later.
Let’s count our chickens
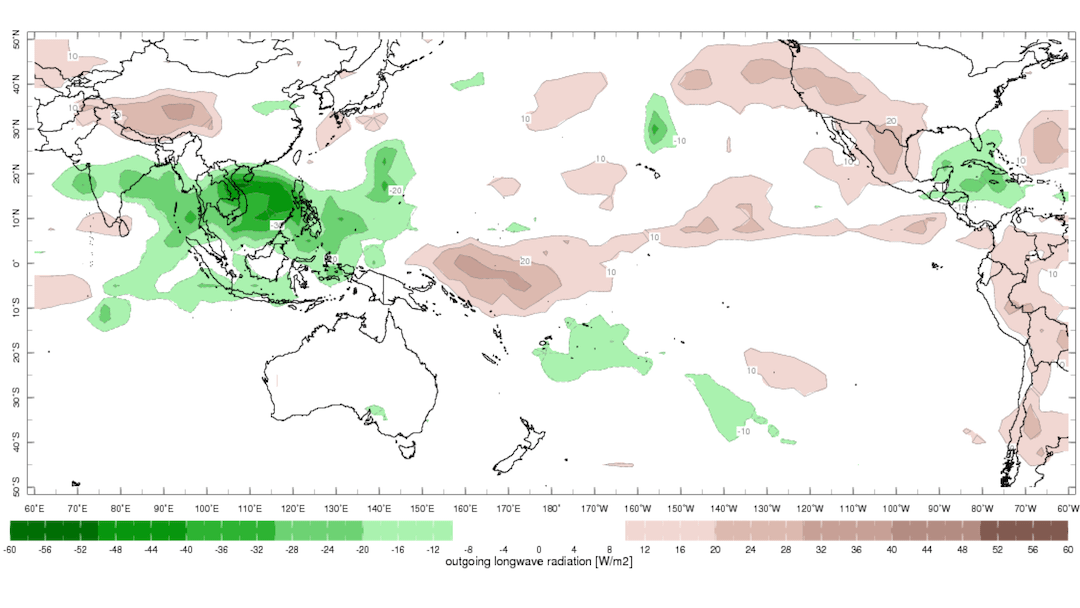
First, we’ll check in with the tropical Pacific ocean-atmosphere system. One of the ways we monitor the atmospheric response to ENSO is through satellite images of the amount of thermal radiation leaving the Earth’s surface. Clouds block this outgoing long-wave radiation, so when the satellites see less outgoing long-wave radiation than average, it means more clouds and rain than average. Conversely, when the satellite picks up more OLR, the skies are clearer than average.
During La Niña, we’d expect to see less rain than average over the central tropical Pacific and more rain over Indonesia—the strengthened Walker circulation, La Niña’s atmospheric response. The OLR map for October 2020 shows this pattern clearly.

Another component of the strengthened Walker circulation is stronger Pacific trade winds, the near-surface winds that blow from east to west near the equator, and stronger west-to-east winds high up in the atmosphere. Both strengthened wind patterns were observed during October, providing more evidence that the ocean-atmosphere coupling we expect during both phases of ENSO is present.
As Michelle discussed just a couple of weeks ago, this coupling is a feedback mechanism that strengthens ENSO. In the case of La Niña, cooler-than-average waters in the tropical Pacific mean the difference between the warm western Pacific and the cooler central Pacific is greater than average. This greater difference leads to the stronger Walker circulation, and the stronger trade winds further cool the surface water in the central Pacific and also pile up warm water in the west. For more details on this feedback, and a whiff of fresh-baked bread, check out Michelle’s post.
Eggs in baskets
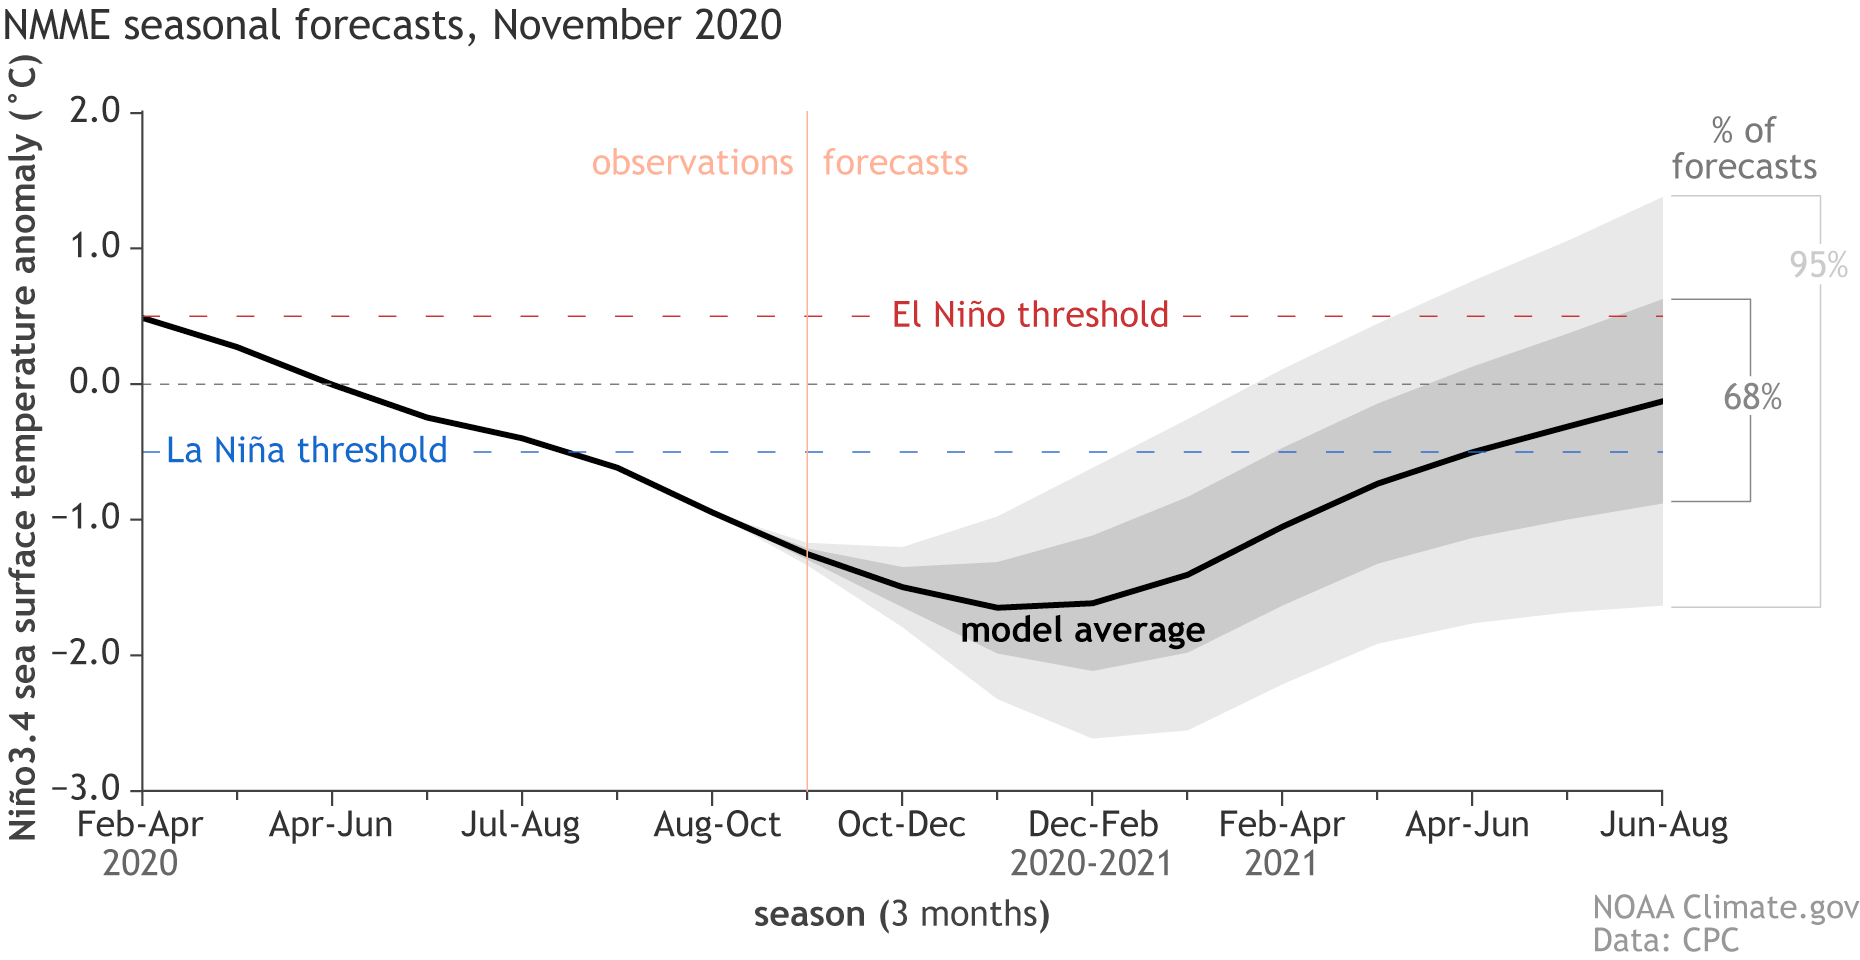
Several computer models are suggesting that this La Niña is likely to be a stronger event, with a Niño 3.4 anomaly during November–January cooler than -1.5°C.

The substantial atmospheric coupling supports these predictions, as does the amount of cooler water under the surface. These cooler subsurface waters, which are also evidence of the coupled system, will provide a source of cooler-than-average water for the surface over the next few months. October’s average subsurface temperature was the 7th-coolest October since 1979.
The Climate Prediction Center is now providing a probabilistic outlook for the strength of El Niño and La Niña events. Tom described this new technique in a blog post a little while back—it’s too much to get into here, so please check out his post for the details. While forecast probabilities are provided for every season, it is the November–January season that has the largest chance (54%) of Niño-3.4 being below -1.5°C. This would make it a strong event; of the 23 La Niña events since 1950, seven have had maximum Niño 3.4 cooler than -1.5°C.
What came first
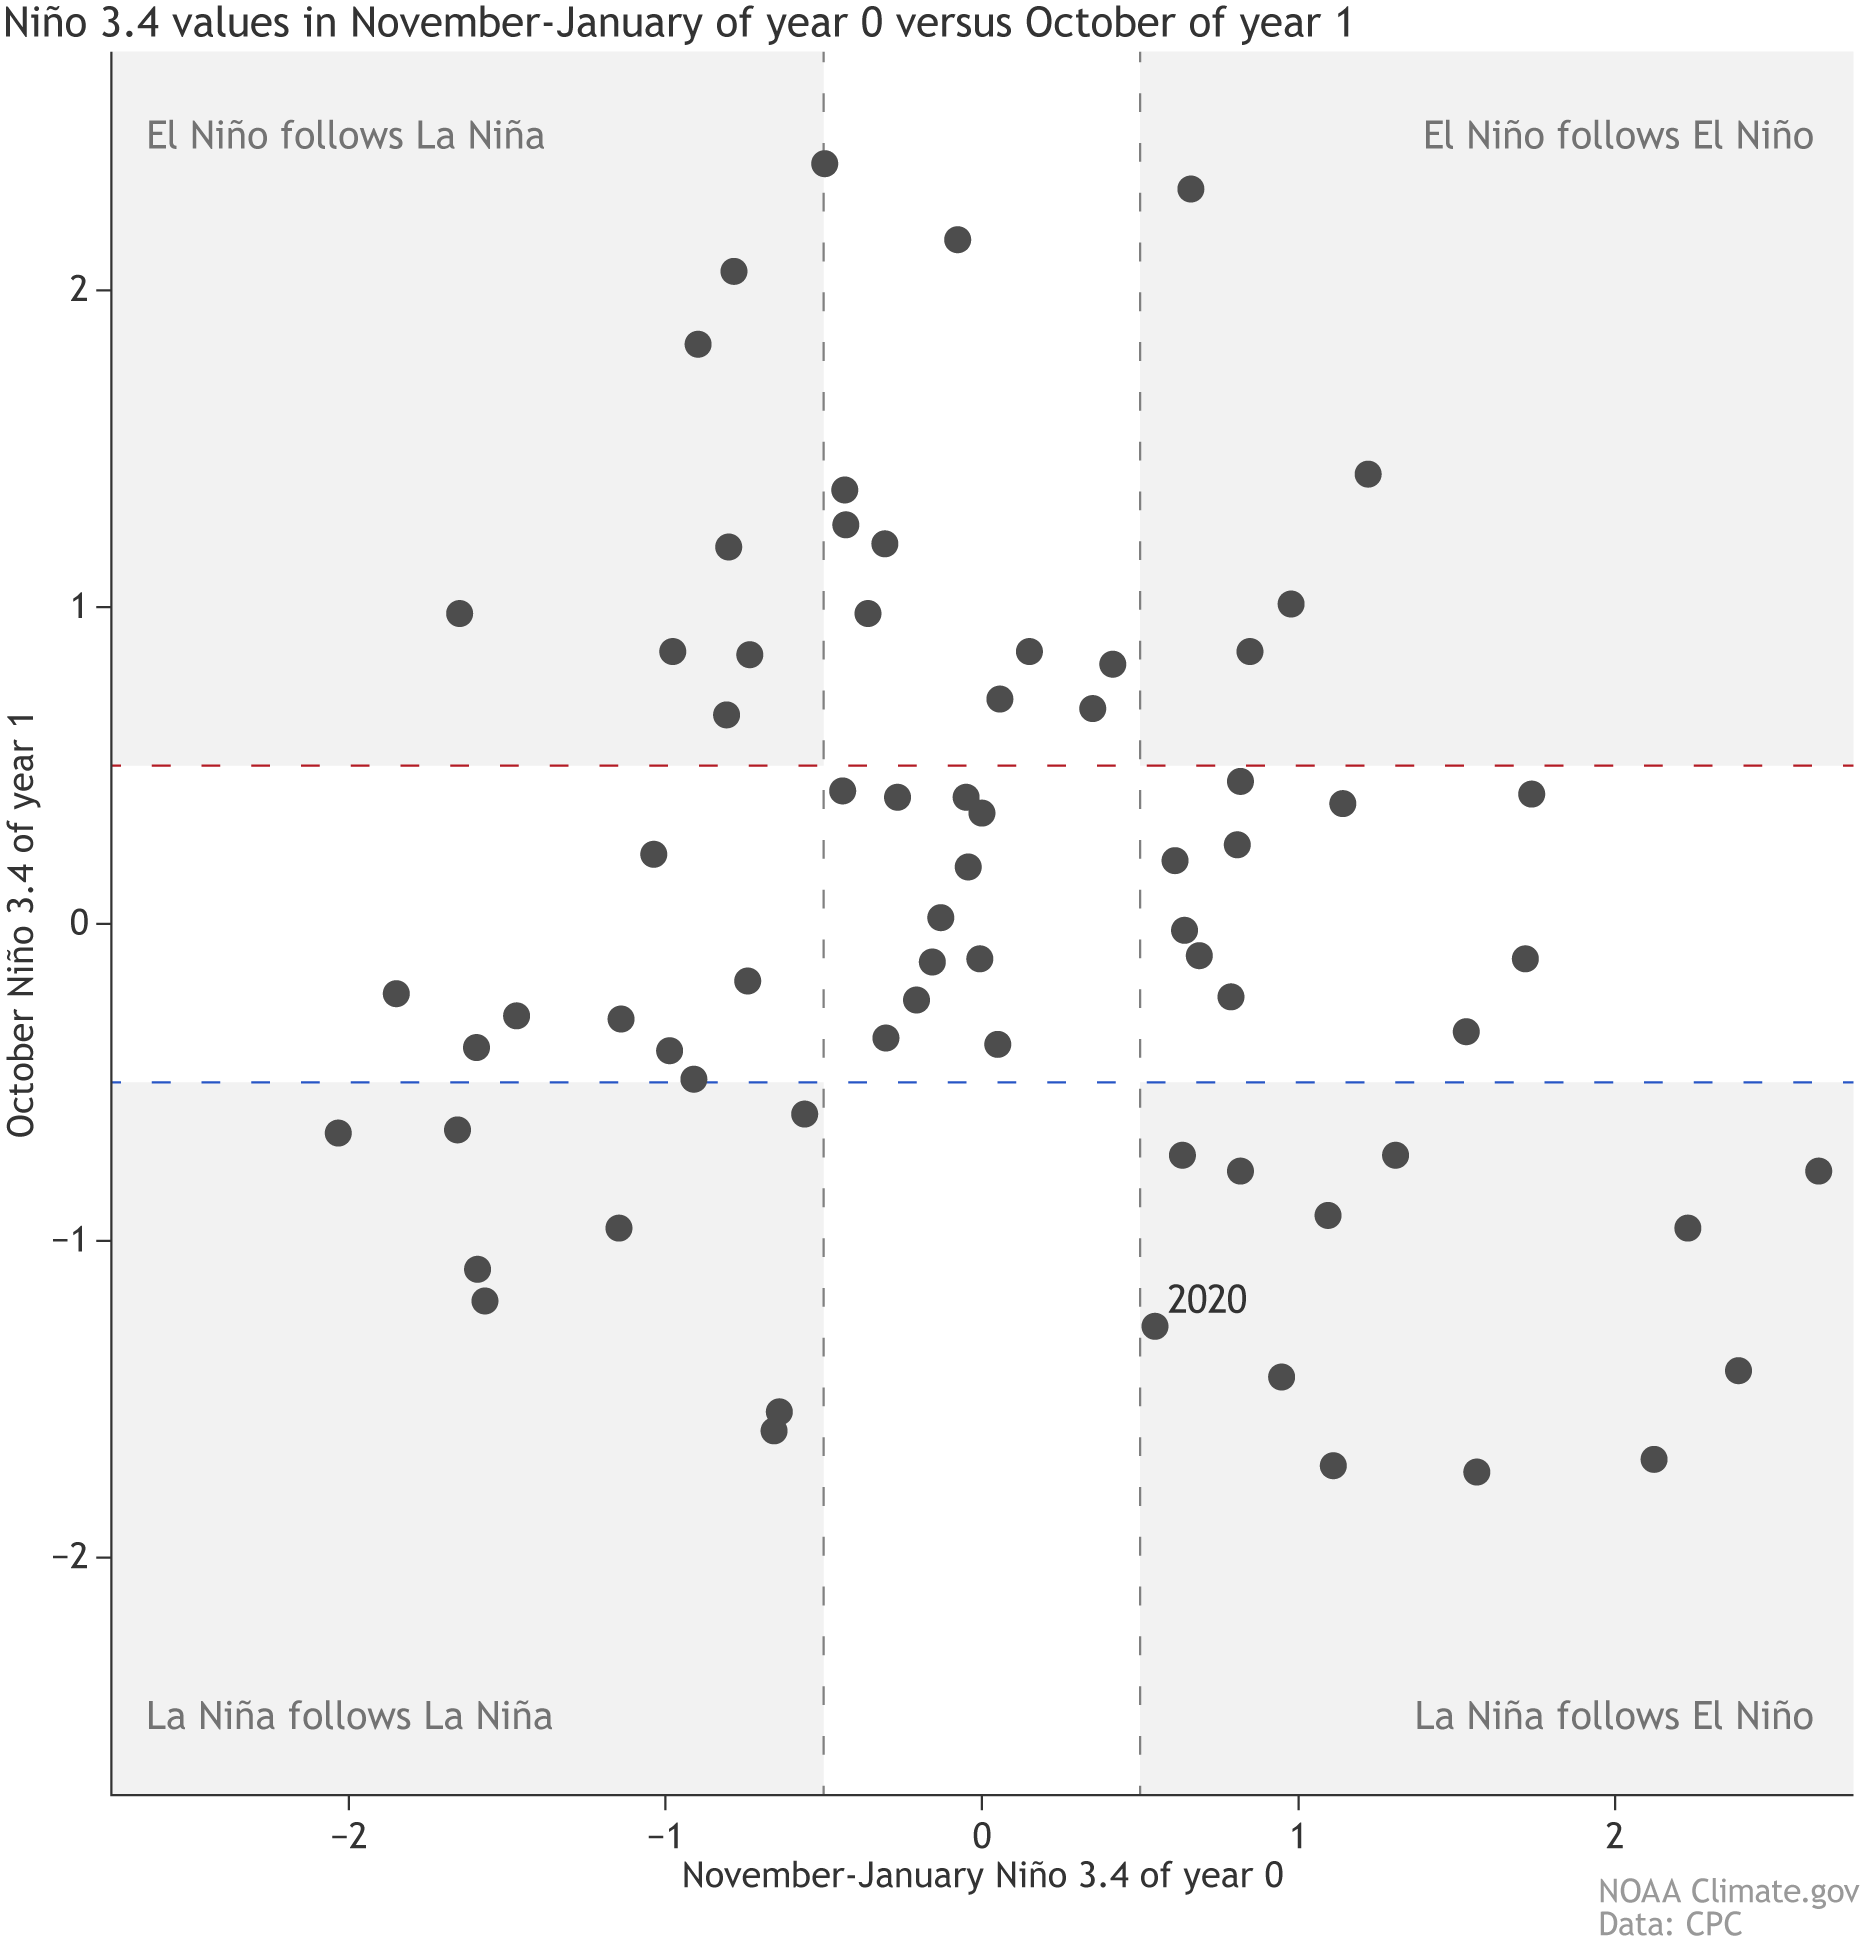
As we’ve observed in a few earlier posts about this La Niña, it appears to be relatively rare in our observed record (starting in 1950) for La Niña to develop following a neutral or slightly warm winter like we had in 2019–2020. I got curious about this, so I thought I’d exercise my newfound Python skills a bit and look at the data. (Python is a computer programming language. I’m not a snake wrangler…yet!)

It turns out that the previous La Niña events we’ve observed so far (dots below the blue line) have all been preceded by either El Niño or La Niña. 2020 stands out, following a winter where tropical Pacific sea surface temperatures were slightly warm, but not quite El Niño. Since we only have about 70 years of observations, it’s hard to say exactly how unusual this is—we’d need to do more studies with climate models to find out, but that’s a lot for my monthly ENSO Blog post, to say nothing of my Python skills!
When the conditions come home to roost
We pay so much attention to ENSO because it affects global weather and climate; a stronger La Niña event means these effects are more likely. We’ve already seen hints of some of the weather and climate patterns we’d expect during La Niña. The most obvious one of these is the extraordinarily active Atlantic hurricane season. La Niña leads to reduced shear (the change in wind from the surface to the upper levels) in the atmosphere over the Atlantic, allowing hurricanes to grow and strengthen.
Although October is a little early for clear La Niña impacts, global precipitation and temperature patterns during the month did give some hints of a La Niña effect, including more rain in Indonesia, drier conditions in southeastern China and the U.S. Southwest, and cooler weather in Canada and into the U.S. Northern Plains. I wrote about potential impacts in more detail last month, so check that out if you missed it.
Nat will cover the winter outlook for North America in his post later this month. And of course, we’ll be here, brooding over La Niña and keeping you up-to-date.