February 2017 ENSO update: bye-bye, La Niña!
Well, that was quick! The ocean surface in the tropical Pacific is close to average for this time of year, putting an end to La Niña, and forecasters expect that it will hover around average for a few months. Let’s dig in to what happened during January, and what the forecast looks like.
Not with a bang
This La Niña wasn’t exactly one for the record books. Our primary index, the three-month-average sea surface temperatures in the central Pacific Niño3.4 region, only dipped to about 0.8°C cooler than the long-term average during the fall of 2016. However, these cooler-than-average temperatures persisted for several months, and the atmosphere over the tropical Pacific responded as expected to the cooler waters. Namely, during the fall and winter to date, the Walker Circulation was strengthened: stronger near-surface east-to-west trade winds, stronger upper-level west-to-east winds, more rain than usual over Indonesia, and less rain over the central Pacific.
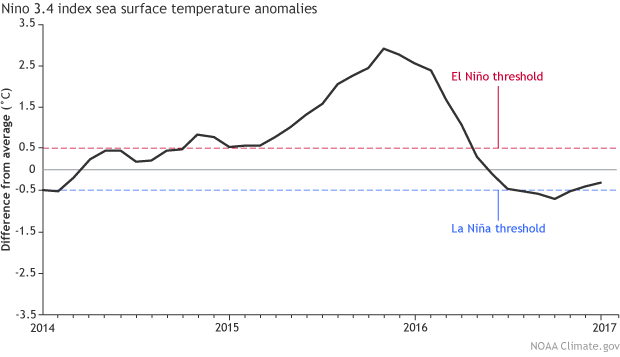
During January, the sea surface temperature edged close to normal, and the average temperature in the Niño3.4 region was just about 0.3°C below normal by the end of the month. (Note, this is using the weekly OISST data. There are some differences between our sea surface temperature data sets, which Tom described in detail here.)
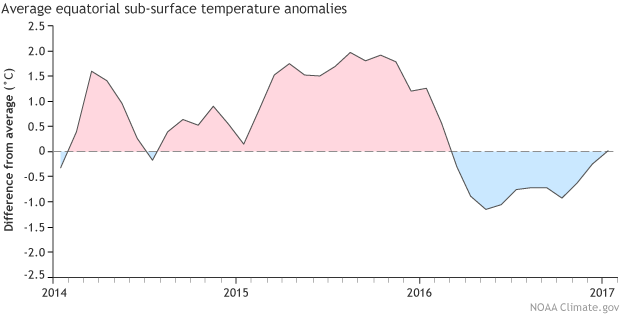
Another factor that we watch is the temperature of the tropical Pacific Ocean below the surface. Over the past few months, the amount of cooler-than-average water at depth has been decreasing, and by the end of January it had disappeared. These deeper waters often give an idea of what we can expect at the surface in following months. Meaning, the lack of cooler water at depth makes it unlikely that the surface will cool off again substantially in the next few months.
There was also some evidence of a lingering La Niña effect on the Walker Circulation during January, with more rain and cloudiness over Indonesia and less over the central Pacific. Also, the trade winds along the equator in the western Pacific were slightly stronger than average in January, but the upper-level winds were about average.
Overall, the atmosphere/ocean system is demonstrating that it’s returned to ENSO-neutral conditions, putting an end to the not-so-great La Niña of 2016/17.
What’s in store for 2017?
Most computer models agree that neutral sea surface temperatures will continue for the next few months, and forecasters estimate an approximately 60% chance of neutral conditions lasting through the spring. After that, it gets a bit more complicated. Some of the computer models are calling for a return of El Niño conditions by the second half of 2017.
These models have a pretty good track record, so we’re not completely ignoring them. However… Remember the so-called spring predictability barrier? Here’s a brief recap of Michelle’s great post: computer models (and human forecasters) have a very hard time predicting the future when the March–May period is in the way. In fact, a forecast made in June for the sea surface temperature in December (six months away) can be more successful than a forecast made in February for May (three months away)!
One of the reasons models have a hard time looking past the spring is that spring is often a transitional time, when ENSO events wind down and neutral conditions prevail. It can be tougher to predict the change into a new phase than to predict the growth, continuation, or demise of an event.
The bottom line is that we’re giving the odds of developing El Niño conditions a slight edge for fall 2017, with the probability around 50%. The baseline chance of El Niño, La Niña, or neutral conditions occurring in the fall of any random year are about 33% each. Our current consensus forecast for the September—November 2017 period estimates a 12% chance of La Niña conditions, 40% chance of neutral conditions, and a 48% chance of El Niño.
Meanwhile, in the far eastern Pacific…
Sea surface temps in the central Pacific may have returned to near-average, but the surface waters near the coast of Peru are quite a bit warmer than average.
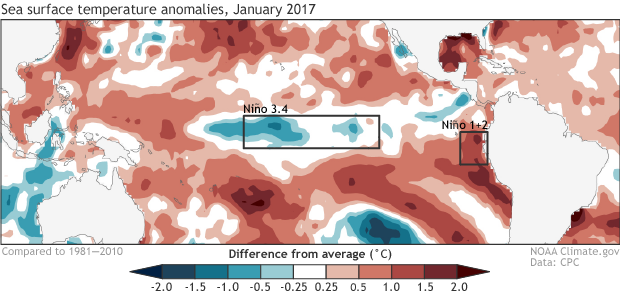
The sea surface temperature in the Nino1+2 region has been trending upward for the past few months, and recently jumped to around 1.2°C above average during January.
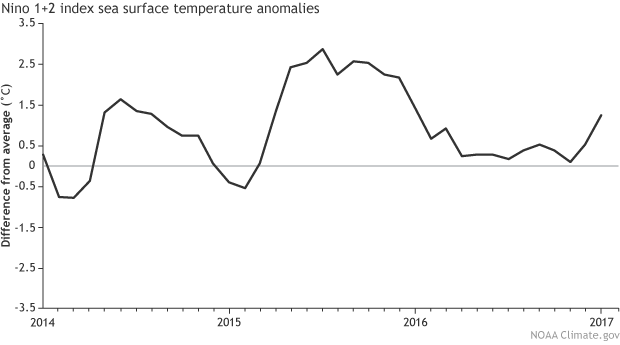
Our colleague Ken Takahashi of the Instituto Geofisico del Peru says that their country is officially in a “coastal El Niño” based on the anomaly in the Niño1.2 region. Note, this is very different from our definition of El Niño! Peru has experienced heavy rains and flooding over the past few weeks, which is expected when the Niño1+2 region warms substantially. Peru is affected both directly by the warm water on their coast, and indirectly by atmospheric circulation changes caused by sea surface temperatures in the central Pacific, whereas ENSO affects the U.S. only by the indirect “teleconnections.”
Heading into the spring and summer, we’ll keep a close eye on the ENSO forecast, and on various ENSO-related happenings around the world. Watch this space!