 If you haven’t heard yet, it’s looking very likely that La Nina will grace us with her presence once again this coming winter. A La Nina Watch is currently in effect.
“ENSO-neutral conditions are present and La Niña is favored to develop during the Northern Hemisphere summer 2016, with about a 75% chance of La Niña during the fall and winter 2016-17.” – NOAA, today
In an official NOAA El Nino Update released today NOAA stated that we have a 75% chance of seeing La Nina in winter 2016/17 (see bottom of article).

We’ve got our fingers crossed for a Strong La Nina. The last time we had a Strong La Nina was in 2010/11 and the USA got huge snowfall totals. Check out the list below:
2010/11 “Strong La Nina” Snowfall Totals:
- Alpine Meadows, CA = 852″
- Squaw Valley, CA = 811″
- Mt. Baker, WA = 808″
- Alta, UT = 723″
- Mammoth, CA = 668″
- Mt. Bachelor, OR = 665″
- Whistler, B.C. = 622″
- Jackson Hole, WY = 557″
- Jay Peak, VT = 376″

June ENSO discussion: The New Neutral
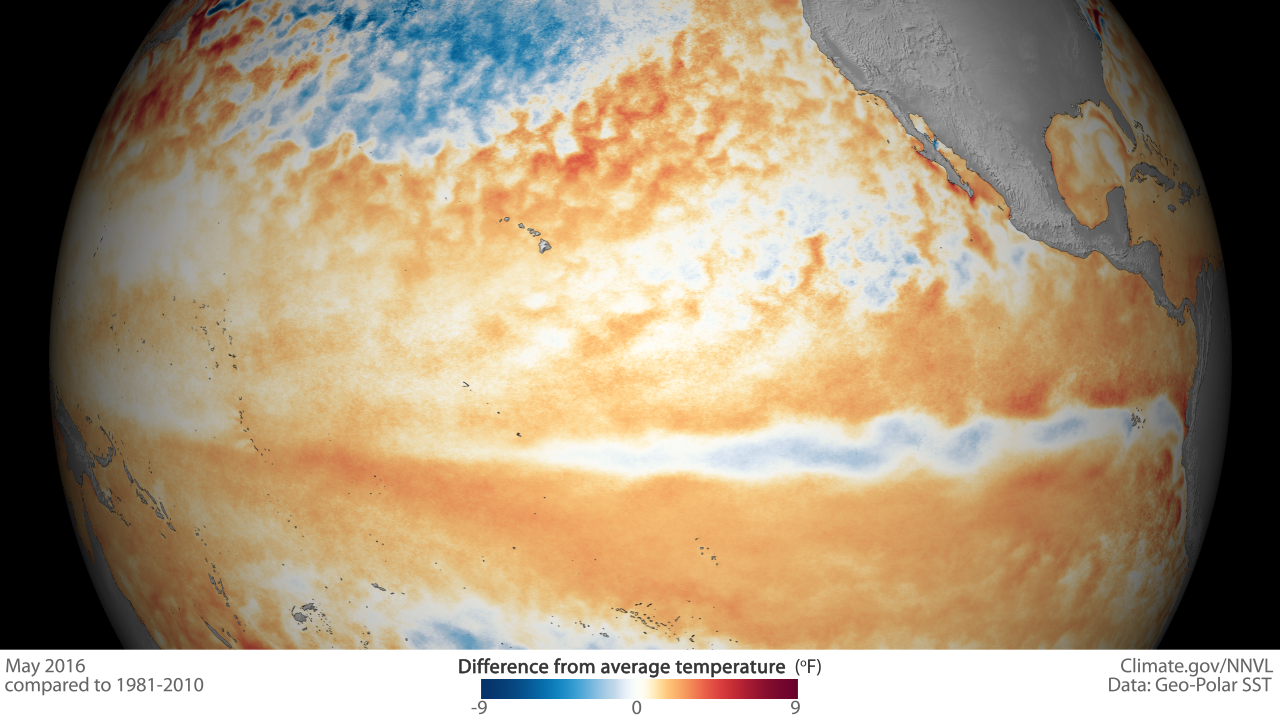
We’re sticking a fork in this El Niño and calling it done. After spending more than a year above average, sea surface temperatures in the central and eastern equatorial Pacific had mostly returned to near average by the end of May. Forecasters don’t think we’ll remain in neutral territory for long, though. There’s an approximately 65% chance that sea surface temperatures will drop into the La Niña realm (more than 0.5 degrees below normal) by the July – September period. This chance increases to around 75% by the fall.
I’ll get into what’s behind these numbers in a bit, but first, let’s bid a fond farewell to the big 2015-2016 El Niño.
The king is dead!
As we’ve reiterated many times in this blog, the El Niño/La Niña (ENSO) cycle is characterized by the changes in tropical Pacific temperatures and the corresponding response of the atmosphere. During El Niño, atmospheric changes include weaker trade winds and upper-level winds, more convection and rainfall in the central or eastern Pacific, and drier conditions over the far western Pacific and Indonesia. Over the past few months, the tropical Pacific has cooled off rapidly, and all these atmospheric indicators returned to average conditions during May.

Generalized Walker Circulation (December-February) during ENSO-neutral conditions. Convection associated with rising branches of the Walker Circulation is found over the Maritime continent, northern South America, and eastern Africa. NOAA Climate.gov drawing by Fiona Martin.
This El Niño was often compared to the 1997/98 event, because the ocean temperatures in the keyNiño3.4 region in the Pacific followed a similar progression, and the peak departure from normal in the 3-month-average was the same: 2.3°C (4.1°F) above normal. However, this event differed from that one in a lot of ways, including the impact on United States precipitation during the winter.

Equatorial Pacific sea surface temperature, 2015-2016 (left) compared to 1997-1998 (right). Each row in this type of image is the departure from average at that time. Weekly data is shown starting in January 2015 and 1997 (top). Data ends at the end of May 2016 (left) and end of June 1998 (right). Climate.gov figure from CPC data.
For one thing, there was more ocean surface warming in the western Pacific and less warming in the eastern Pacific during 2015/16 than 1997/98. Also, the amount of warm water under the surface was less during 2015/16 than 1997/98. (If you want to compare all kinds of information about the ocean during the two events, you can check out the Ocean Reanalysis Comparison site.) The atmospheric response during 2015/16 was also generally weaker than during 1997/98.
In short, as you’ve heard many times on this blog, no two El Niños are alike.
Why am I reviewing all this? Because we don’t expect the rest of 2016 to look exactly like 1998 did, either, even though ocean temperatures in the Niño3.4 region have followed a very similar decline. Just looking at one number (the Niño3.4 index) can give an incomplete picture of the evolution of ENSO events. Even though our forecasts are projections for Niño3.4 ocean temperatures, forecasters take a number of current conditions into consideration. In other words, if La Niña develops this fall, don’t expect it to develop just like the one following the 1997/98 event.
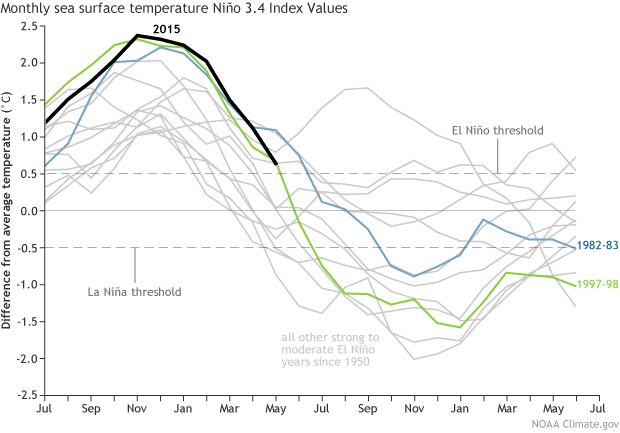
Monthly sea surface temperature in the Niño 3.4 region of the tropical Pacific compared to the long-term average for all moderate-to-strong El Niño years since 1950, showing how 2015/16 (black line) compares to other events. Climate.gov graph based on ERSSTv4 temperature data.
Long live the queen!
Both human forecasters and computers are reasonably confident (75% chance) that sea surface temperatures will cross the La Niña threshold by the winter. However, there’s a fair bit of uncertainty still about how the La Niña would progress, and forecasters are currently favoring a weak or borderline moderate event.
This spring, the amount of cooler water under the surface of the tropical Pacific is substantial, and it’s been rising up to the surface. This is a source of confidence that sea surface temperature anomalies will continue to cool through the summer.
Dynamical models (large computer simulations that use atmospheric and ocean physics to make predictions) predict that Niño3.4 temperatures will cross the La Niña threshold soon. They don’t, however, foresee a continued steep cooling. Most forecasts from the North American Multi-Model Ensemble are in the region of about -1.25° to -0.5° below normal through the Northern Hemisphere winter.
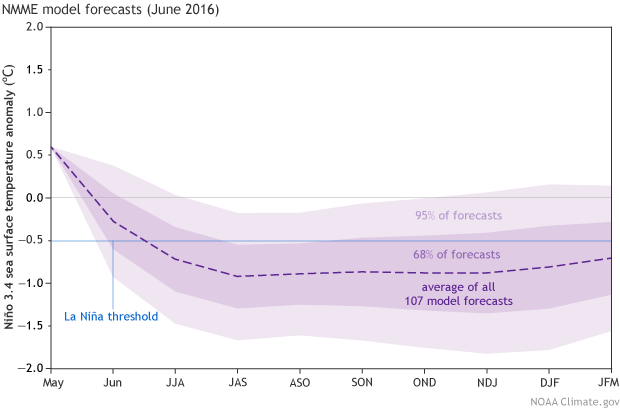
Climate model forecasts for the Niño3.4 Index, from the North American Multi-Model Ensemble (NMME). Darker purple envelope shows the range of 68% of all model forecasts; lighter purple shows the range of 95% of all model forecasts. NOAA Climate.gov image from CPC data.
Just like it did with El Niño, the atmospheric response to the changed sea surface temperatures should reinforce La Niña. La Niña is characterized by a stronger Walker Circulation, where warm air rises in the far western Pacific/Indonesia, heads eastward at upper levels, descends to the surface over the eastern Pacific, and blows toward the west as the trade winds. Stronger trade winds cool the surface and keep the warmer waters pooled in the western Pacific. Over the summer, we’ll watch this response carefully, for clues about how La Niña might evolve and potentially influence the 2016/17 winter climate.
La Niña’s effect on U.S. summer climate is limited, although it can influence hurricane seasons. NOAA’s official outlooks for the Atlantic and Eastern Pacific hurricane indicate that near-normal seasons are most likely in both. A major source of uncertainty in this outlook is the rate at which La Niña may develop and intensify. Check out the official outlooks, especially the “Reasoning behind the outlook” sections, for more detail on how climate factors, including La Niña, can influence the growth of hurricanes.
EL NIÑO/SOUTHERN OSCILLATION (ENSO) DIAGNOSTIC DISCUSSION
issuedby
CLIMATE PREDICTION CENTER/NCEP/NWS
and the International Research Institute for Climate and Society
9 June 2016
ENSO Alert System Status: Final El Niño Advisory/ La Niña Watch
Synopsis: ENSO-neutral conditions are present and La Niña is favored to develop during the Northern Hemisphere summer 2016, with about a 75% chance of La Niña during the fall and winter 2016-17.
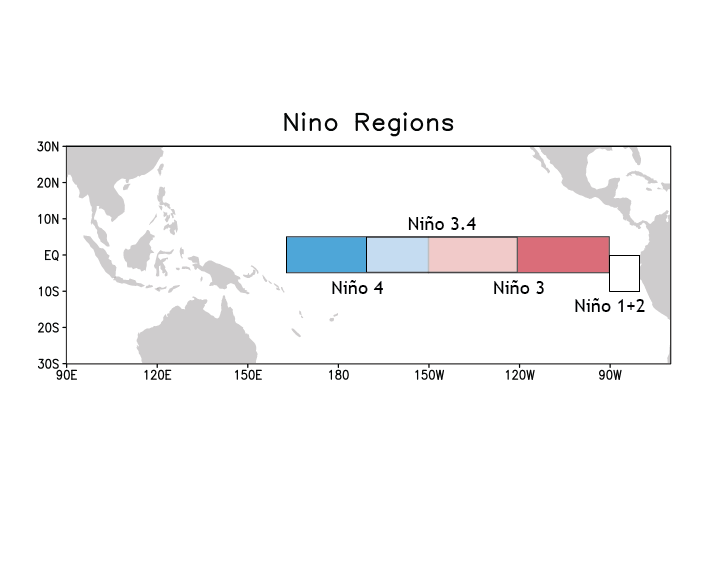
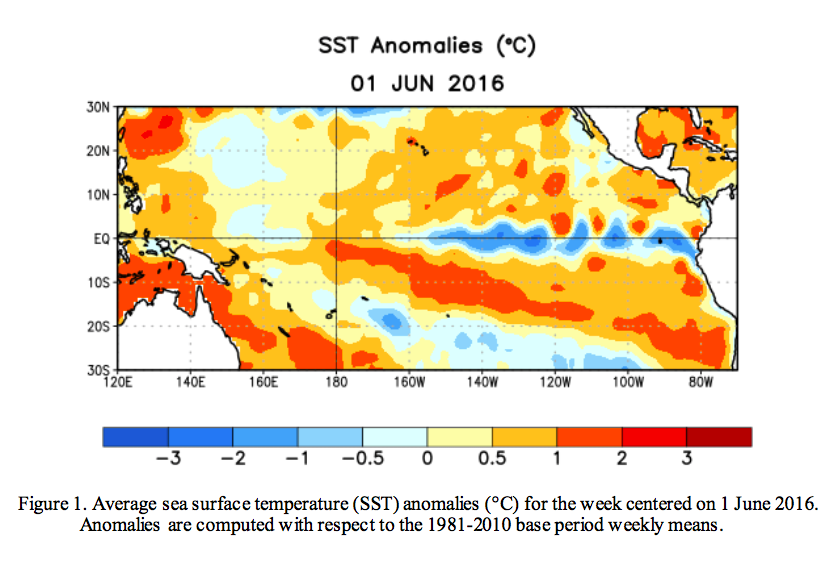
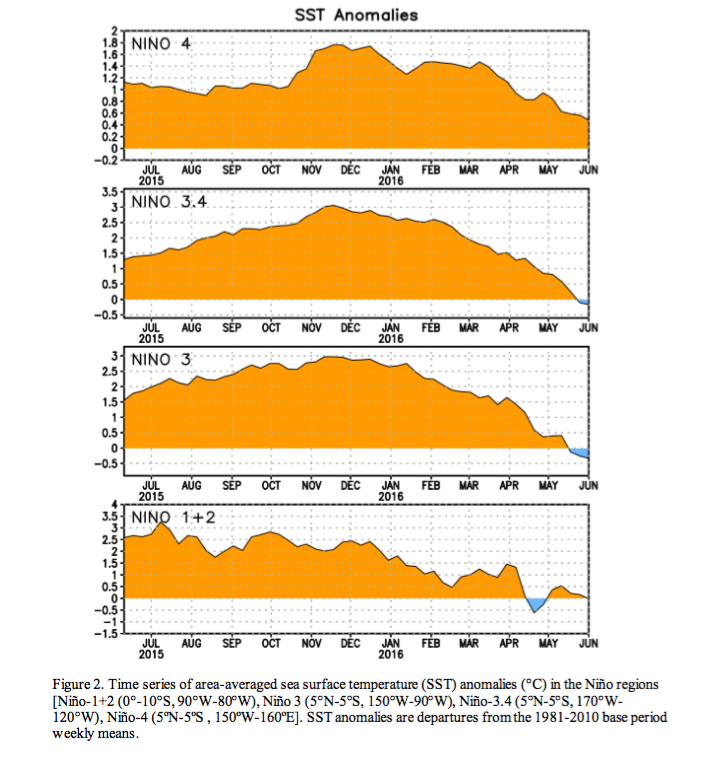
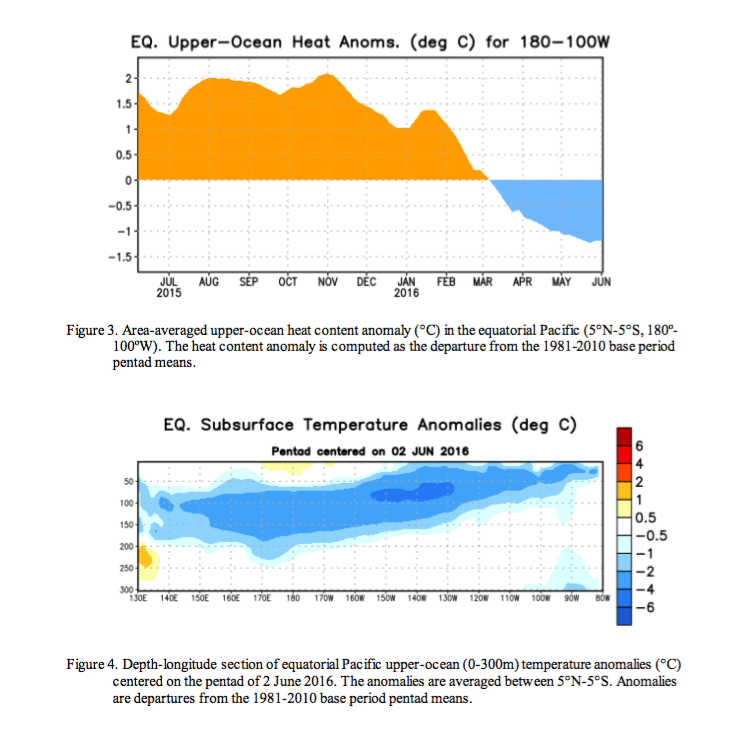
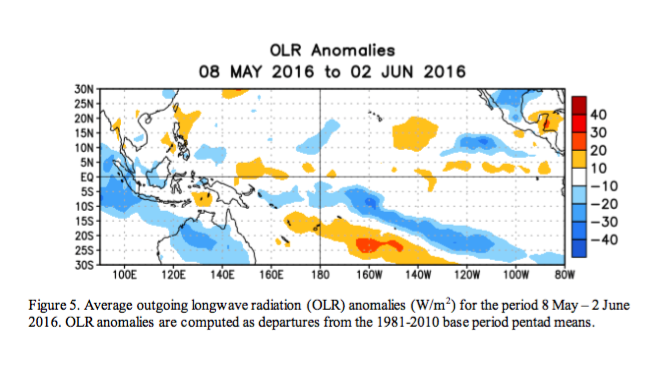
El Niño dissipated and ENSO-neutral conditions returned during over the past month, as indicated by the expansion of near-to-below average surface temperatures (SST) across the eastern equatorial Pacific Ocean (Fig. 1). Other than the westernmost Niño-4 region, the Niño indices were near zerobytheendofMay(Fig.2). Below average subsurface temperature scontinued(Fig.3)and extended to the surface across the eastern equatorial Pacific (Fig. 4). For the first time in 2016, atmospheric anomalies over the tropical Pacific Ocean were also consistent with ENSO-neutral conditions. The traditional and equatorial Southern Oscillation indices were near zero, while the upper and lower-level winds were both near average across most of the tropical Pacific. Convection was also near-average over the central tropical Pacific and over most of Indonesia (Fig. 5). Collectively, these atmospheric and oceanic anomalies reflect a transition from El Niño to ENSO-neutral conditions.
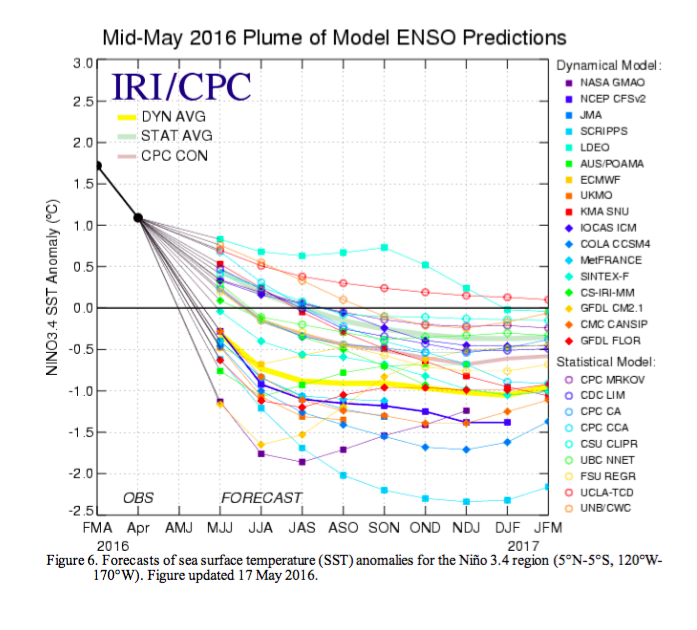
Many models favor La Niña (3-month average Niño-3.4 index less than or equal to -0.5°C) by the Northern Hemisphere fall (Fig. 6). However, most dynamical models indicate La Niña onset as soon as the Northern Hemisphere summer, which is slightly favored by the forecaster consensus. In contrast, many statistical models favor a later onset time, with about half indicating the persistence of ENSO- neutral conditions through the winter. At this time, the forecasters are leaning toward a weak or borderline moderate La Niña if an event were to form. Overall, ENSO-neutral conditions are present and La Niña is favored to develop during the Northern Hemisphere summer 2016, w ith about a 75% chance of La Niña during the fall and winter 2016-17 (click CPC/IRI consensus forecast for the chance of each outcome for each 3-month period).
This discussion is a consolidated effort of the National Oceanic and Atmospheric Administration (NOAA), NOAA’s National Weather Service, and their funded institutions. Oceanic and atmospheric conditions are updated weekly on the Climate Prediction Center web site (El Niño/La Niña Current Conditions and Expert Discussions). Forecasts are also updated monthly in the Forecast Forum of CPC’s Climate Diagnostics Bulletin. Additional perspectives and analysis are also available in an ENSO blog. The next ENSO Diagnostics Discussion is scheduled for 14 July 2016. To receive an e-mail notification when the monthly ENSO Diagnostic Discussions are released, please send an e-mail message to: ncep.list.enso-update@noaa.gov.
Sorry but you are wrong 2011 was a moderate La Nina… stop the hype
Just looked it up. We always thought that 2011 was a strong la nina. It was only a moderate. Good news, tho as a moderate la nina is more likely to happen that a strong. Hopefully we get another year like 2011 next year! thanks.