April 2022 snow summary:
- Snow-covered area for the western United States was 104 percent of average for April, with more snow-covered area in the North than in the South.
- Snow cover days remained well below average for the western United States, indicating a relatively dry year since October 1, 2021.
- In mid-April, snow albedo or snow brightness rapidly increased from widespread snowstorms; however, localized areas like the San Juan mountains in Colorado had low albedo after dust storms darkened the snow’s surface.
- Snow water equivalent (SWE) was below average at 54 percent of reporting stations at the end of April, an improvement from 88 percent of reporting stations a month earlier.
- Stations in more northern locations tended to show a net SWE gain through April, while those in southern locations tended to have a net SWE loss.
- April had wetter and cooler conditions to the north that were consistent with snow patterns; near-term climate forecasts favor the persistence of La Niña conditions.
Overview of conditions

In April 2022, the average snow-covered area in the western United States was 104 percent of average, ranking eleventh in the 22-year satellite record. The snow-covered area for April was 26 percent less than in 2008, which had the highest average snow cover and was 79 percent more than 2015, the year with the least snow-covered area. In 2022, there were 60,000 more square kilometers (23,000 square miles) of snow cover in April relative to a year ago.
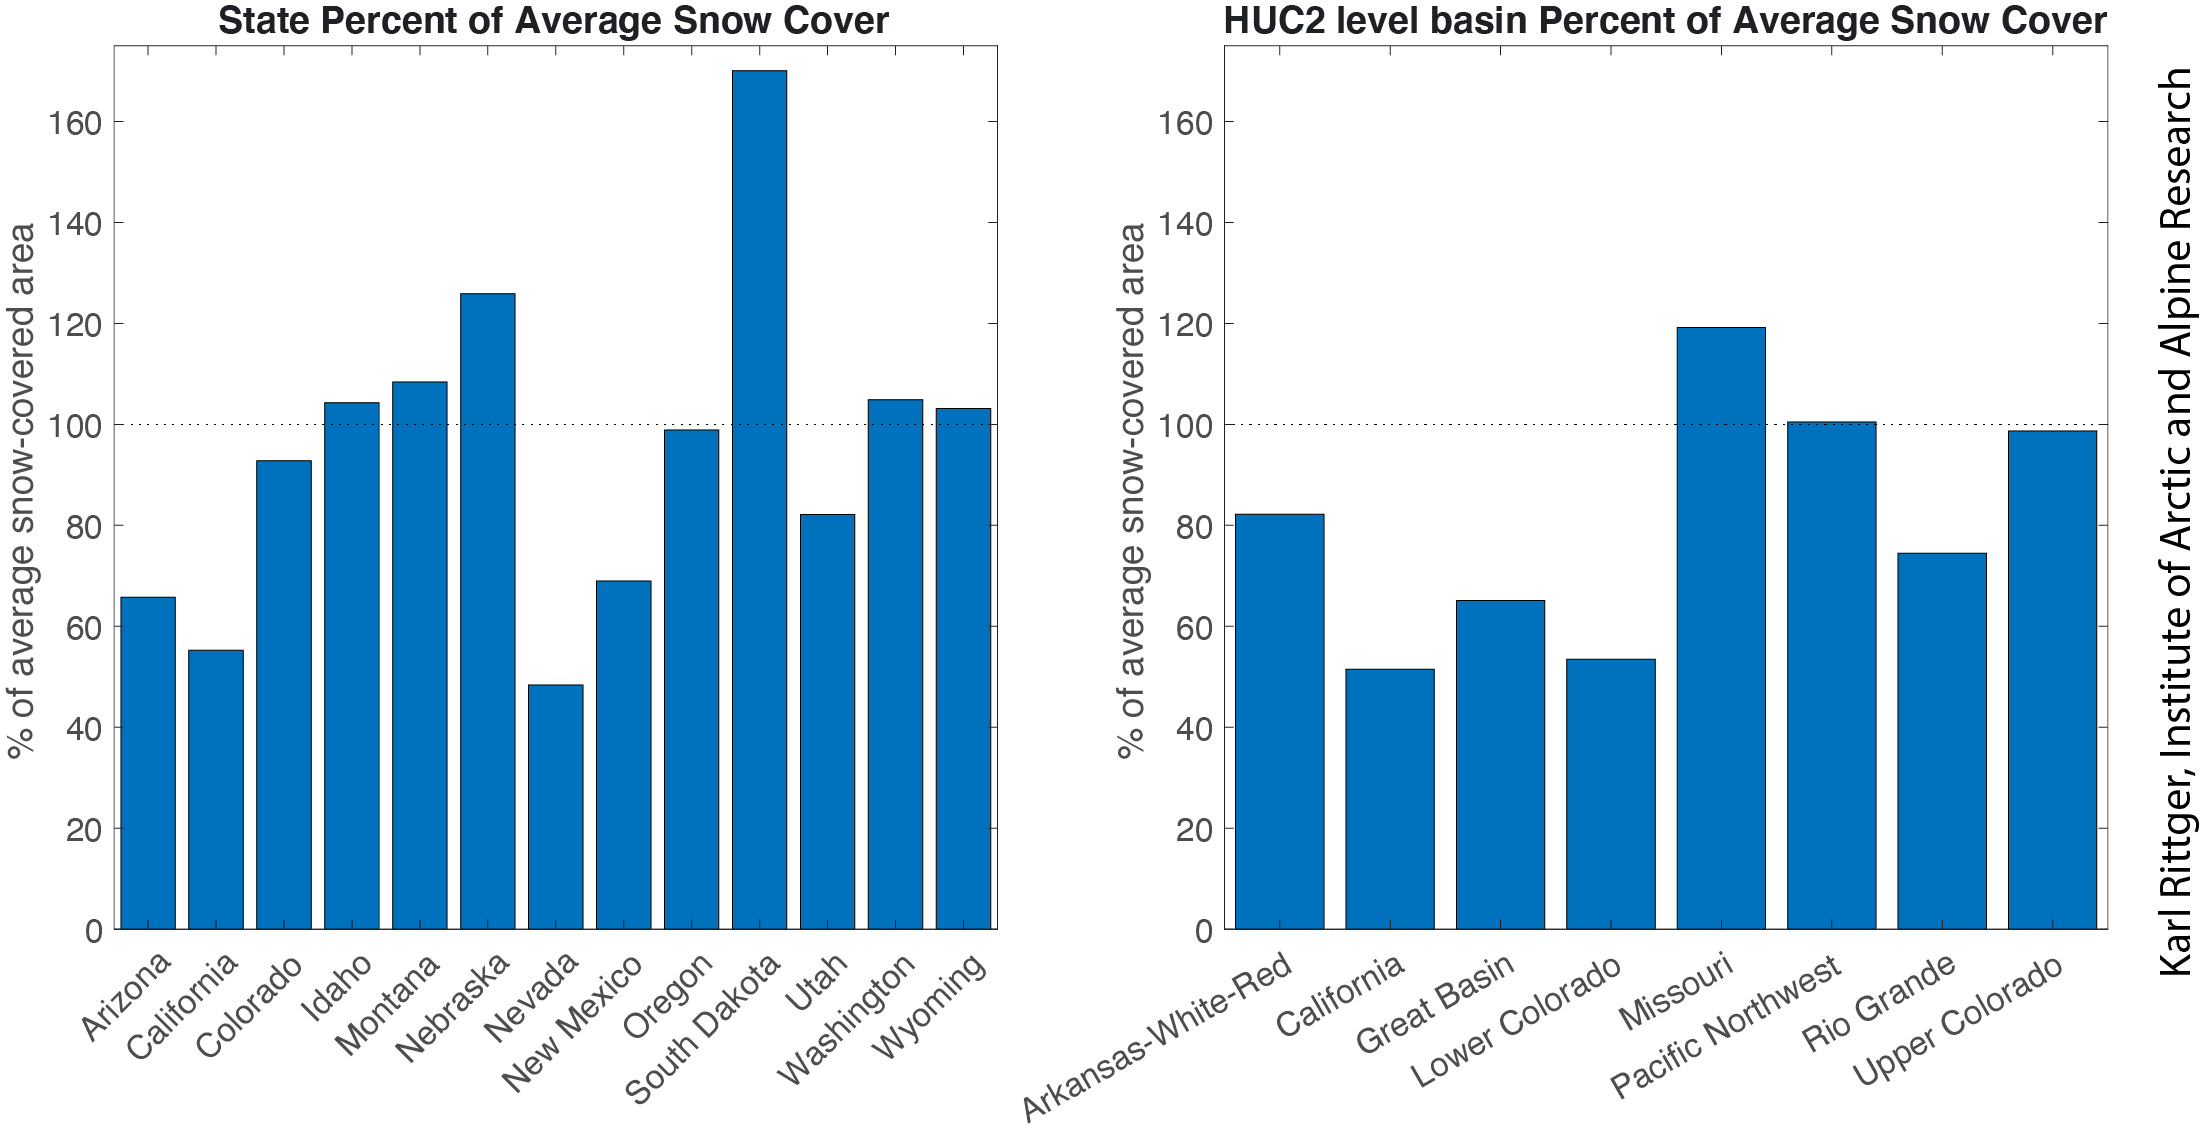
As in March 2022, April had considerable variations in snow-covered area across the western states and eight large river basins in our analysis region, although the patterns differed from March. When the average snow-covered area is low during the melt season, small amounts of snow can have significant impacts on percentages relative to average. For example, the snow-covered area in South Dakota is 170 percent of average for April (Figure 1, left). However, there were only 2,000 square kilometers (770 square miles) of snow-covered area compared to the average of over 1,000 square kilometers (386 square miles) of snow-covered area in April. These numbers for April were much lower than the 20,000 square kilometers (7,700 square miles) of snow-covered area in mid-winter. The 120 percent of average snow-covered area in Nebraska is interpreted similarly. Other states like Colorado, Idaho, Montana, Washington, and Wyoming still had significant snow cover near average for April. Arizona, Nevada, and New Mexico had low percentages relative to average. However, average snow-covered area during April is typically low. By contrast, California still had significant amounts of snow-covered area but had a low percentage relative to average. This was also the case for many large basins (Figure 1, right). See the Total Snow-Covered Area plots on the Daily Images & Data page to access different regions through the drop-down menu for a more detailed understanding of individual basins.
Conditions in context: snow cover
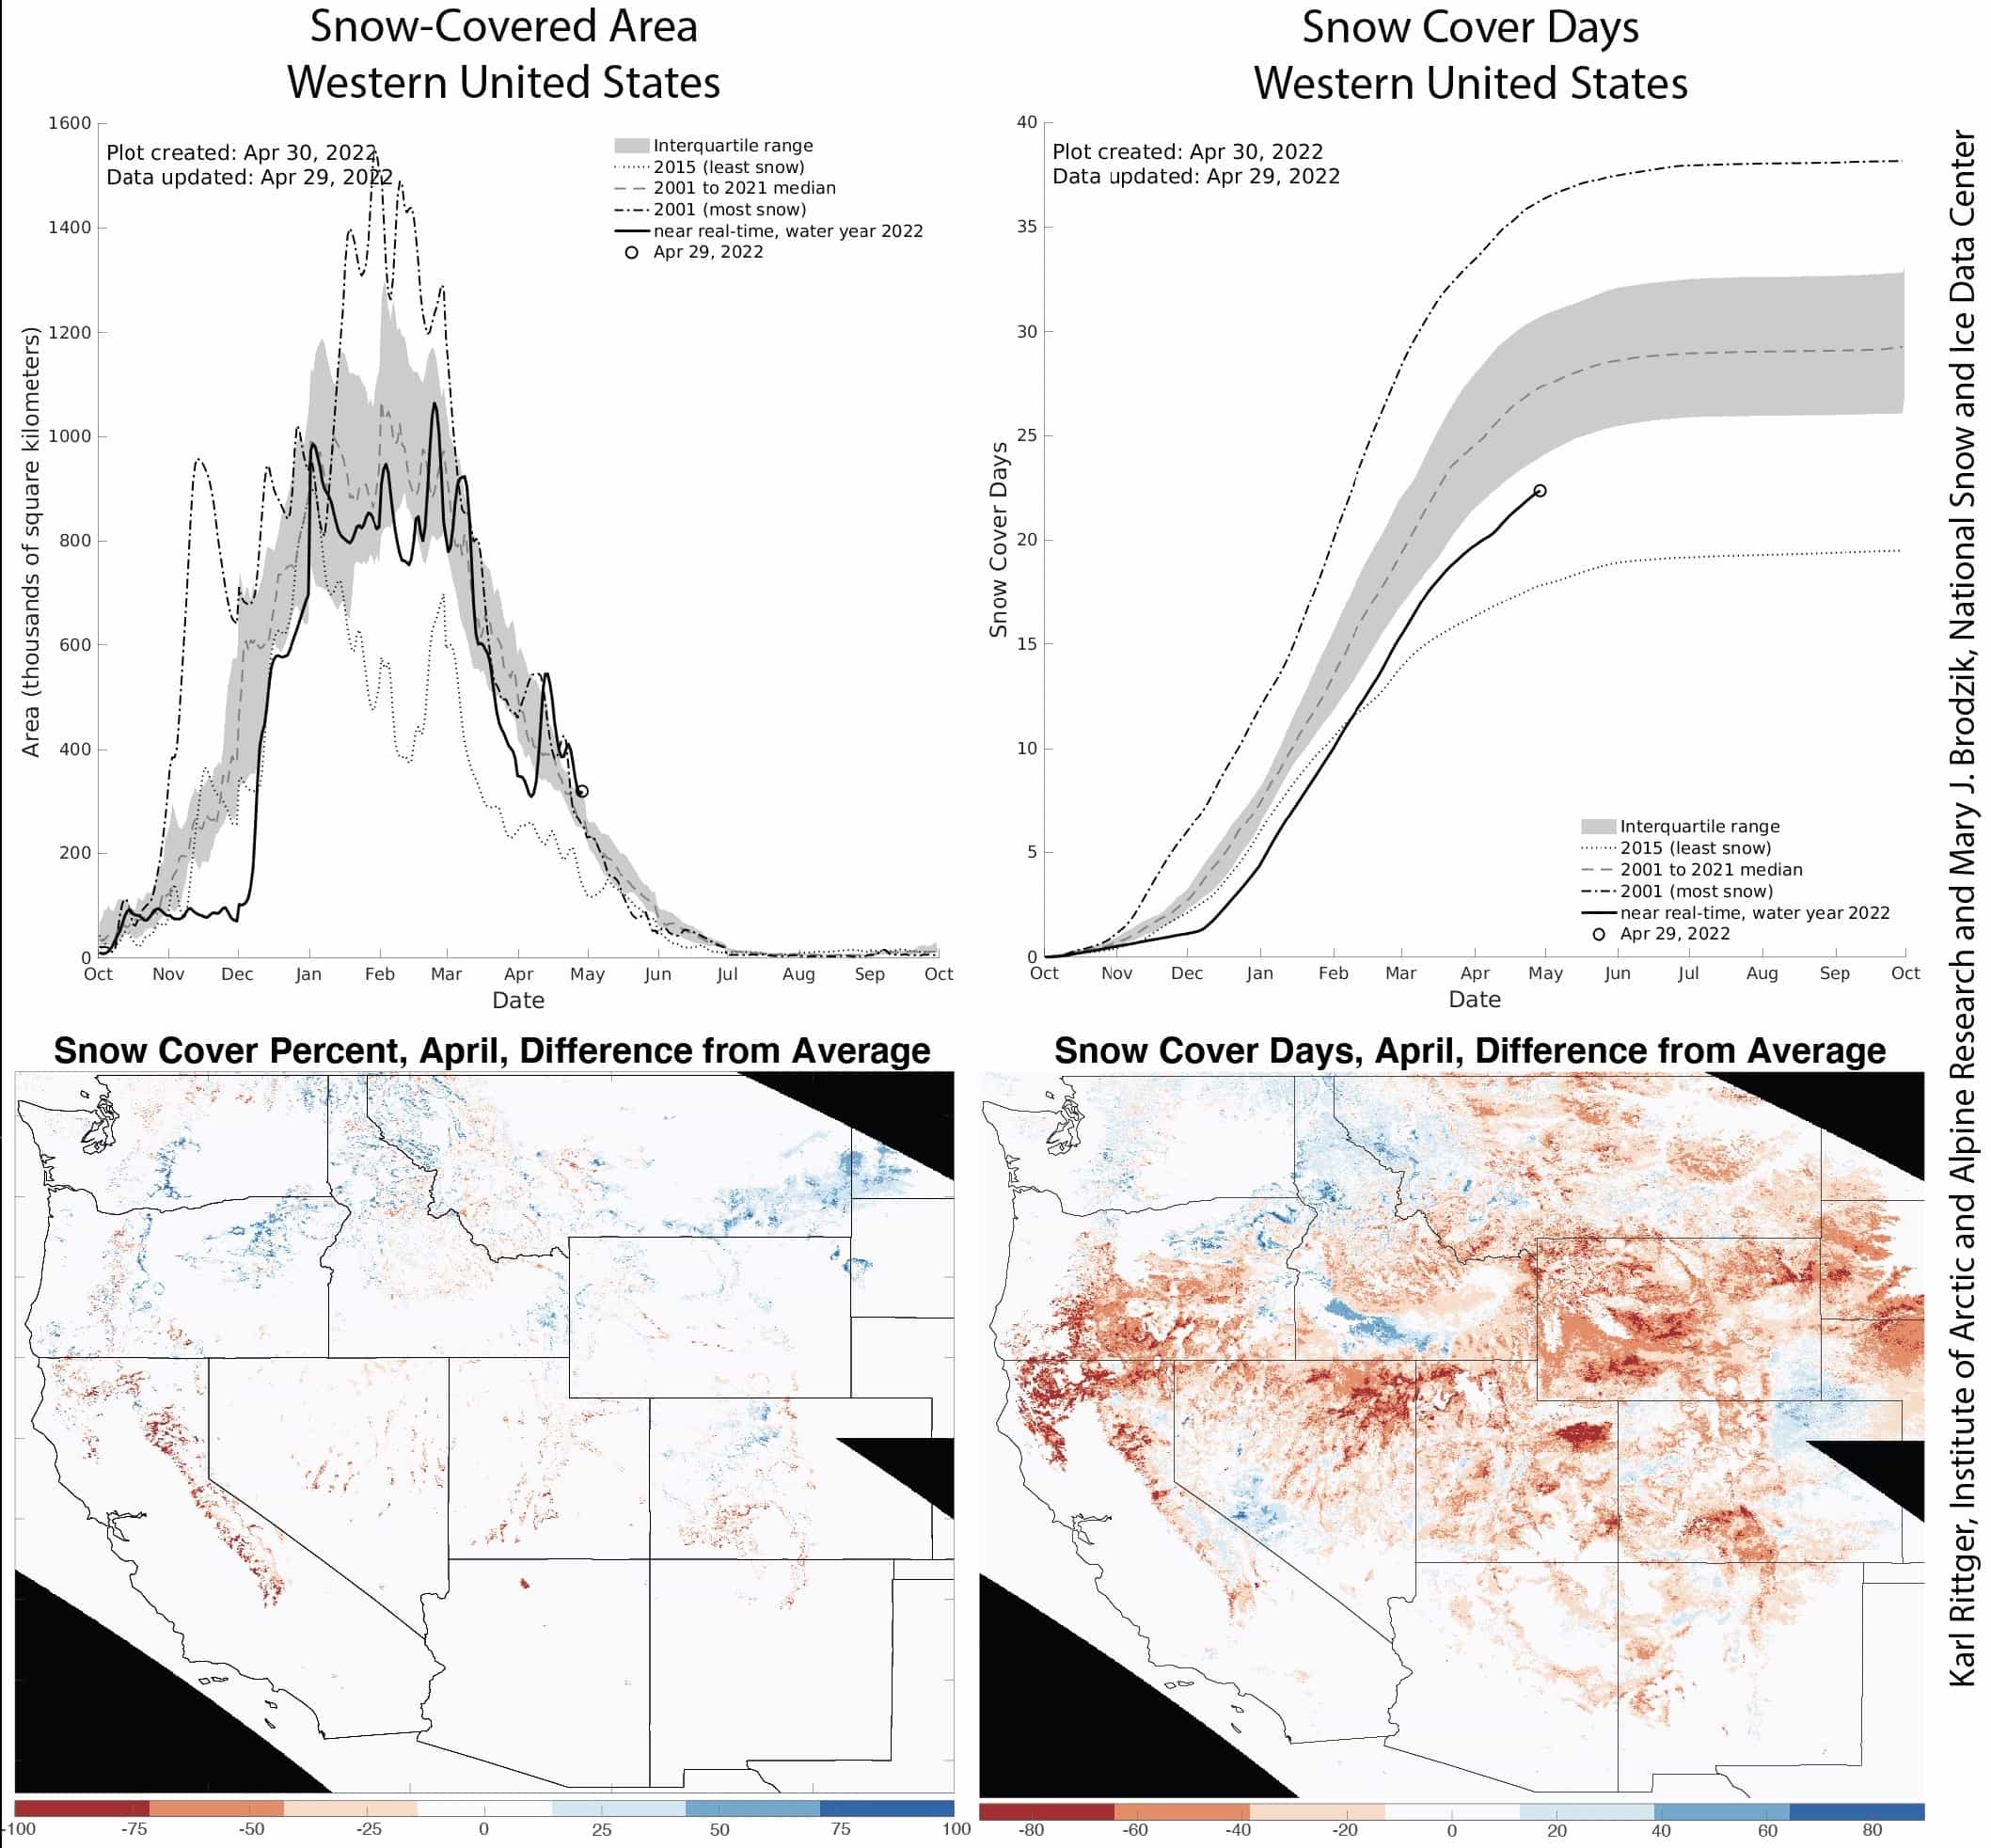
The March pattern of below-average snow-covered area continued in early April. Snow-covered area fell below the interquartile range (Figure 2, upper left). However, mid-month storms brought the snow-covered area to slightly above average for April (Table 1). A map of the difference from average (Figure 2, lower left) shows that locations in the South—California, Nevada, Utah, Arizona, New Mexico, and southern Colorado—had less snow-covered area relative to the satellite record than regions in the North. Snow-covered area in the North was generally above average, though some smaller regions in the northern states also had below-average values.
While the storms in mid-and late April resulted in higher snow-covered area, the number of snow cover days summed from October 1, 2021, to April 30, 2022, remains well below the interquartile range (Figure 2, right). Spatially, below-average snow cover days are the rule over nearly all regions of the western United States (Figure 2, lower right).
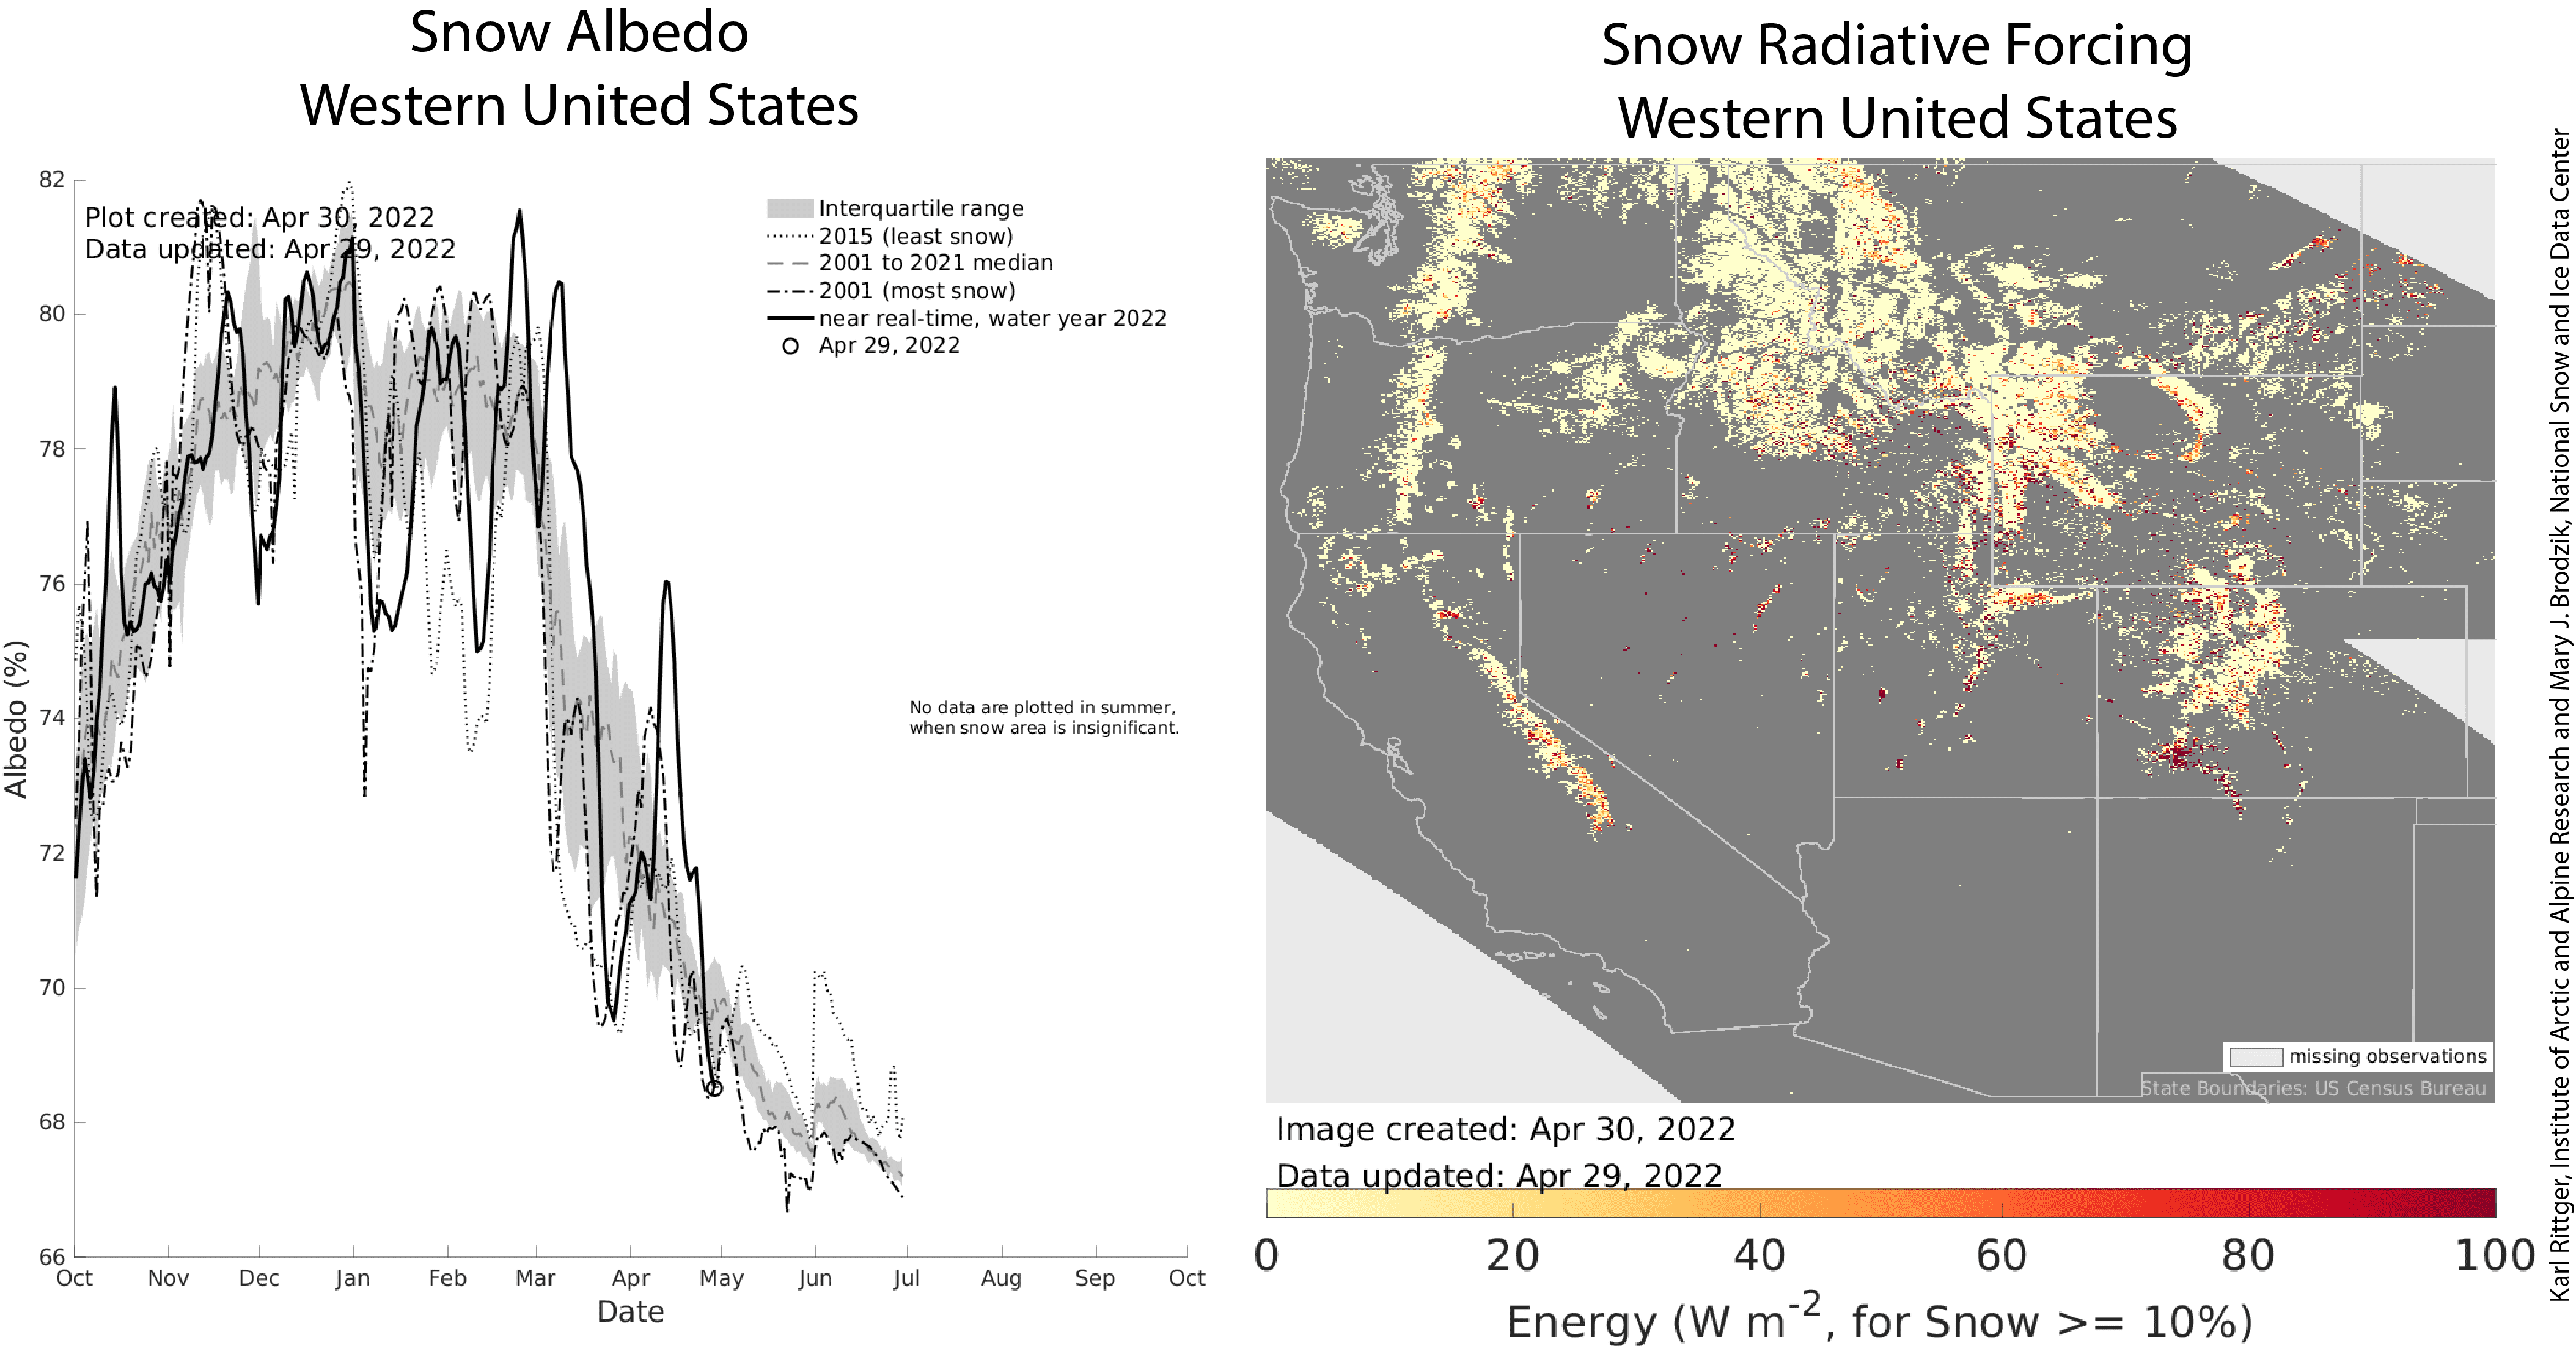
Snow brightness, known as snow albedo, dropped to low values in late March and early April. The storms that increased snow-covered area (Figure 2, upper left) also refreshed the snow albedo in mid-April, propelling the snow’s brightness to well above average values for the melt season. Typically, snow grain size increases as melt progresses and snow ages and absorbs more of the sun’s energy (Figure 3, left). In addition, dark dust can be blown from dry areas that do not have snow and transported to snowpack downwind. As the snow melts, dust also concentrates at the surface, further reducing the albedo and hastening more melt. This is known as albedo feedback. This year, the San Juan mountains in Colorado have been significantly impacted by nearly 100 Watts per meter squared of additional solar energy absorption (Figure 3, right) caused by dust-on-snow events.
Conditions in context: snow water equivalent (SWE)
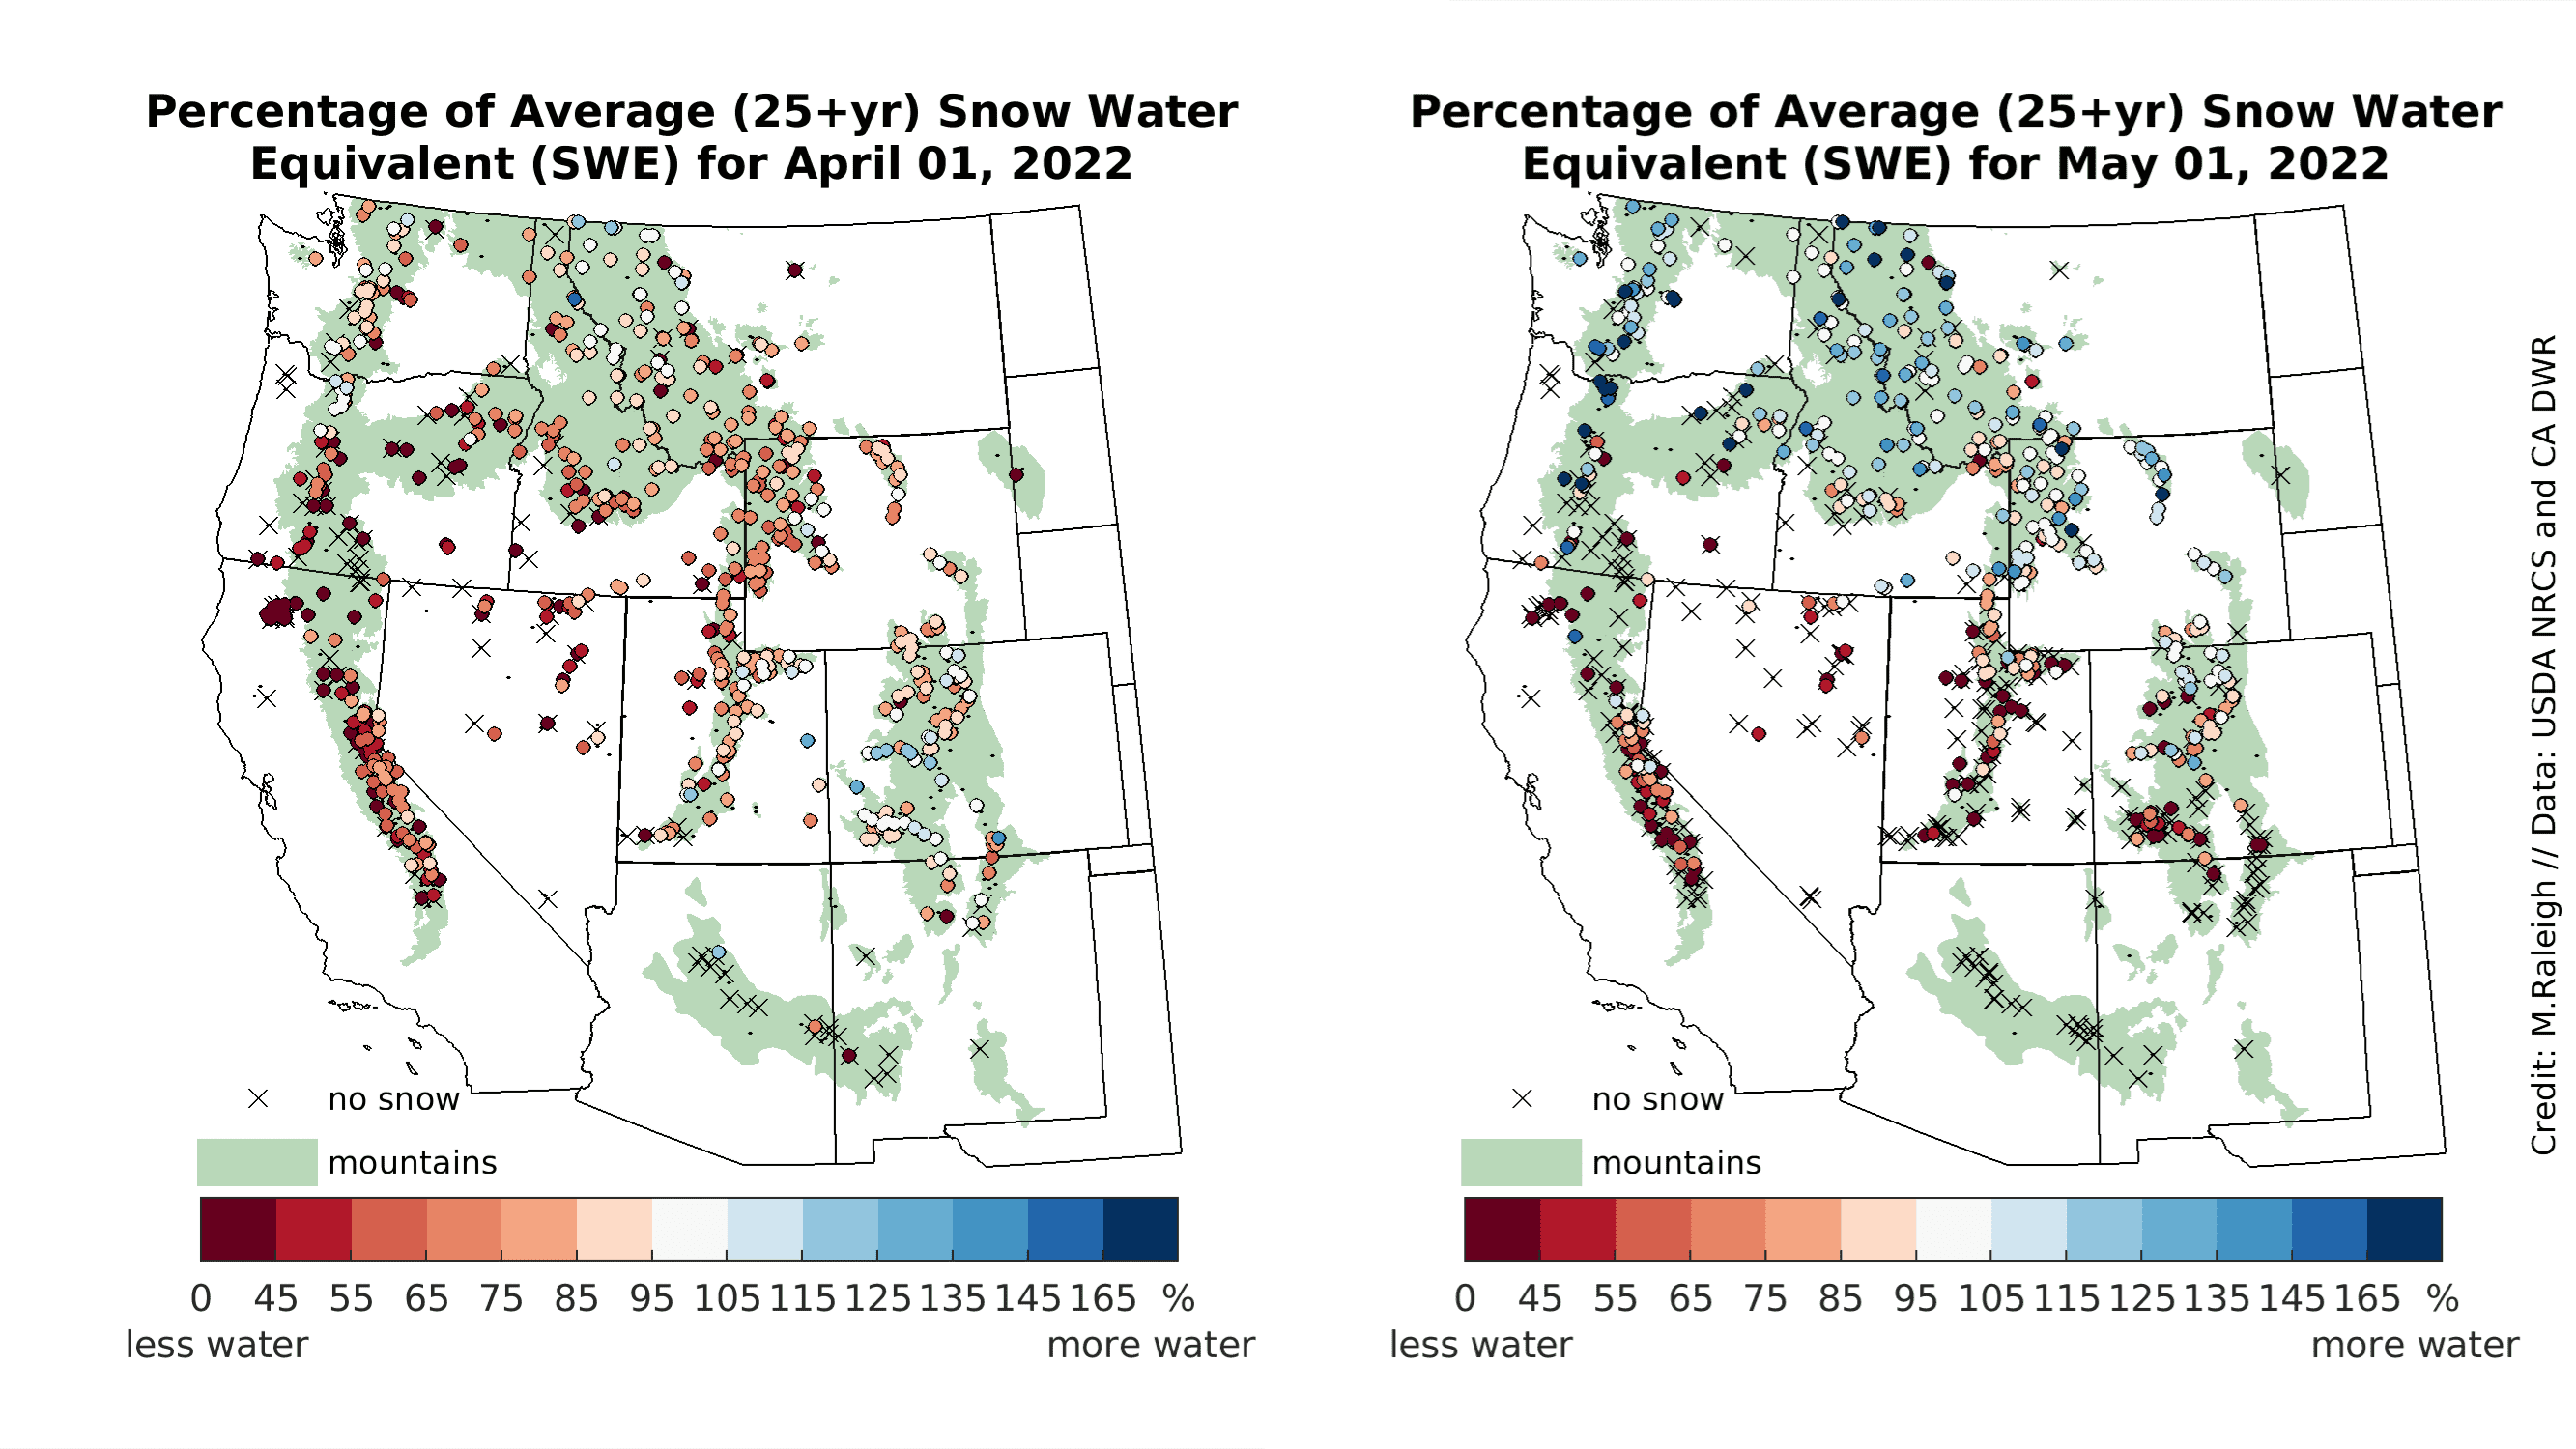
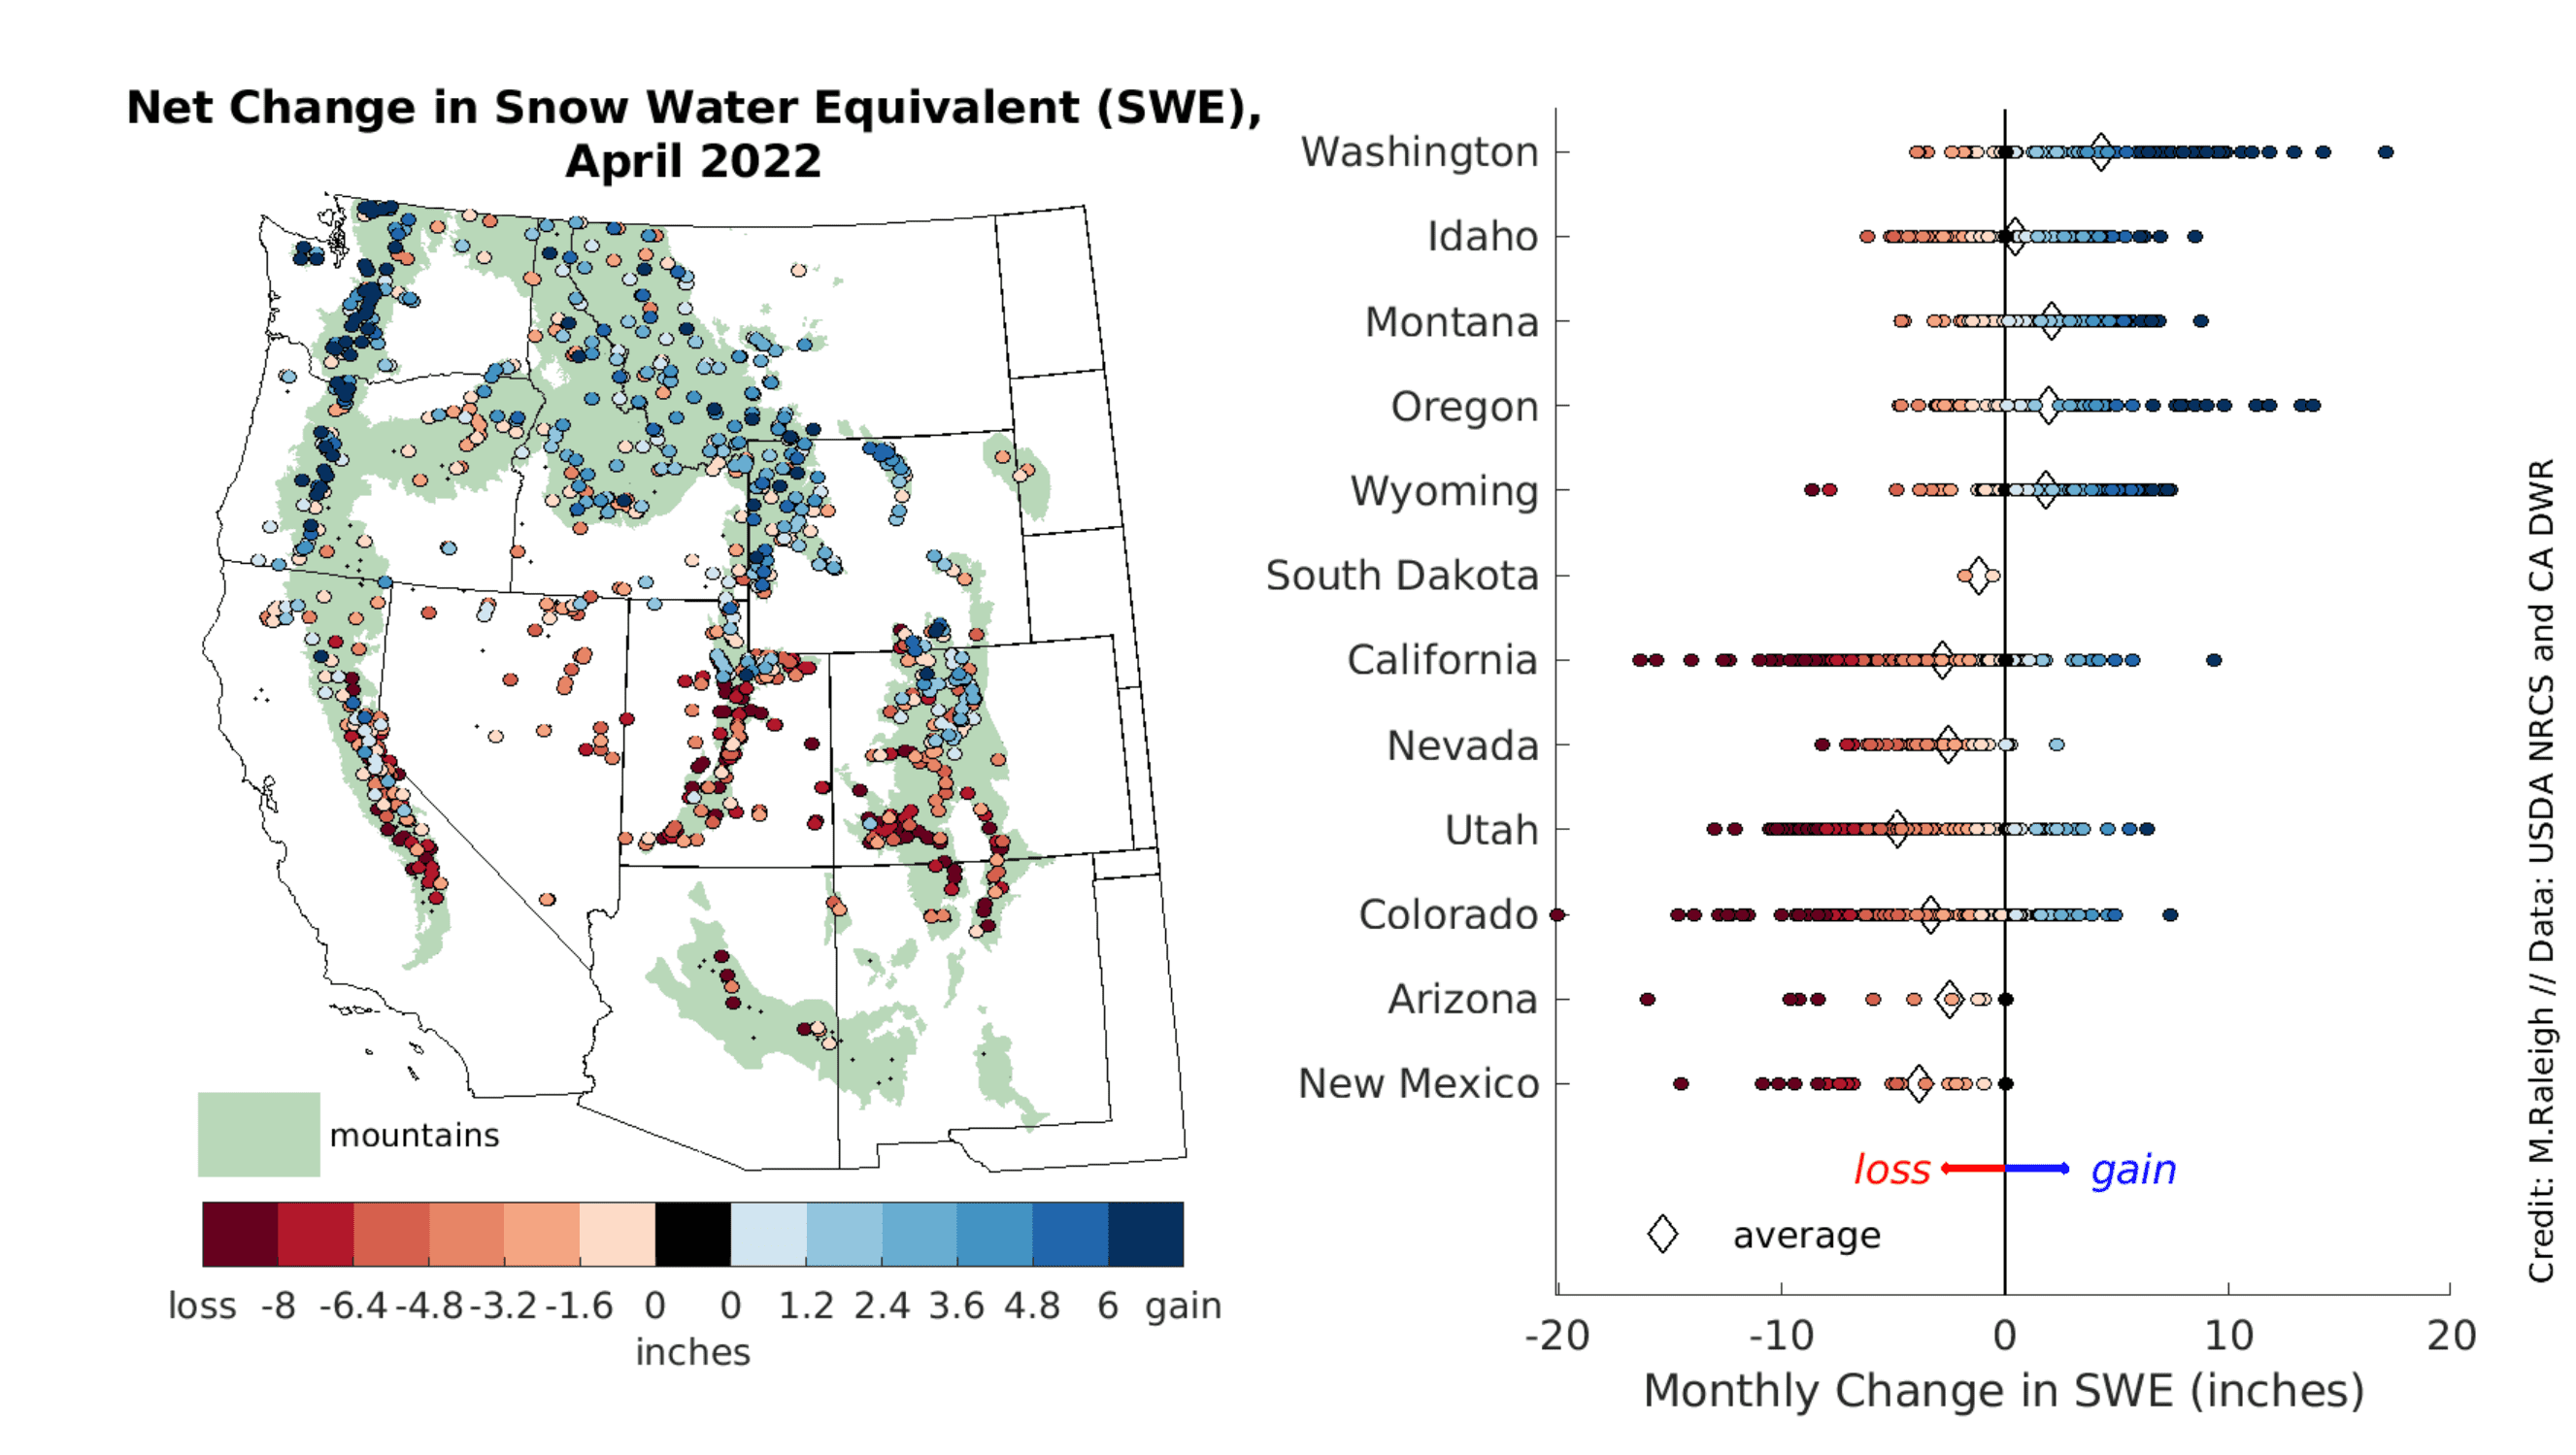
At the start of April 2022, snow water equivalent (SWE) was below average at about 88 percent of stations (Figure 4, left). By the beginning of May, only 54 percent of stations had below-average SWE (Figure 4, right). This improvement in SWE had several causes. Several stations reported average or above-average SWE in more northern locations, thanks to a series of snowstorms through a wet and cool April (discussed more below). Some of these stations were at elevations and in regions that are typically well into the melt season by the start of May. Hence, the April snowstorms resulted in SWE being even higher than expected for this time of year. These storms also increased snow albedo, decreasing melt (Figure 3). SWE remained below average toward more southern locations, and the snowpack melted out at many stations (Figure 4, right). There was a notable decline in SWE in Utah and southern Colorado.
A broad north-to-south pattern was observed in the net change in SWE through April (Figure 5, left). There was an overall net gain in SWE across stations in Washington, Oregon, Idaho, Montana, and Wyoming. In contrast, stations in the southern states showed an overall net loss in SWE (Figure 5, right), similar to the patterns in snow-covered area (see Figure 2, lower left). As a statewide average, Washington showed the most significant net increase in SWE with 11 centimeters (4.3 inches). Utah registered the most significant net loss in SWE at 12.2 centimeters (4.8 inches). On an individual station basis, the greatest net SWE increase was 44.2 centimeters (17.4 inches) at Swift Creek in Washington.
As expected for this time of year, all states had some stations showing a net loss of SWE (Figure 5, right). The most significant net SWE loss was 51 centimeters (20.1 inches) at Columbine Pass in Colorado. No stations in New Mexico, Arizona, and South Dakota showed a net increase in SWE, while only three stations in Nevada had a net SWE increase through April.
A wetter and cooler north, a warmer and drier south
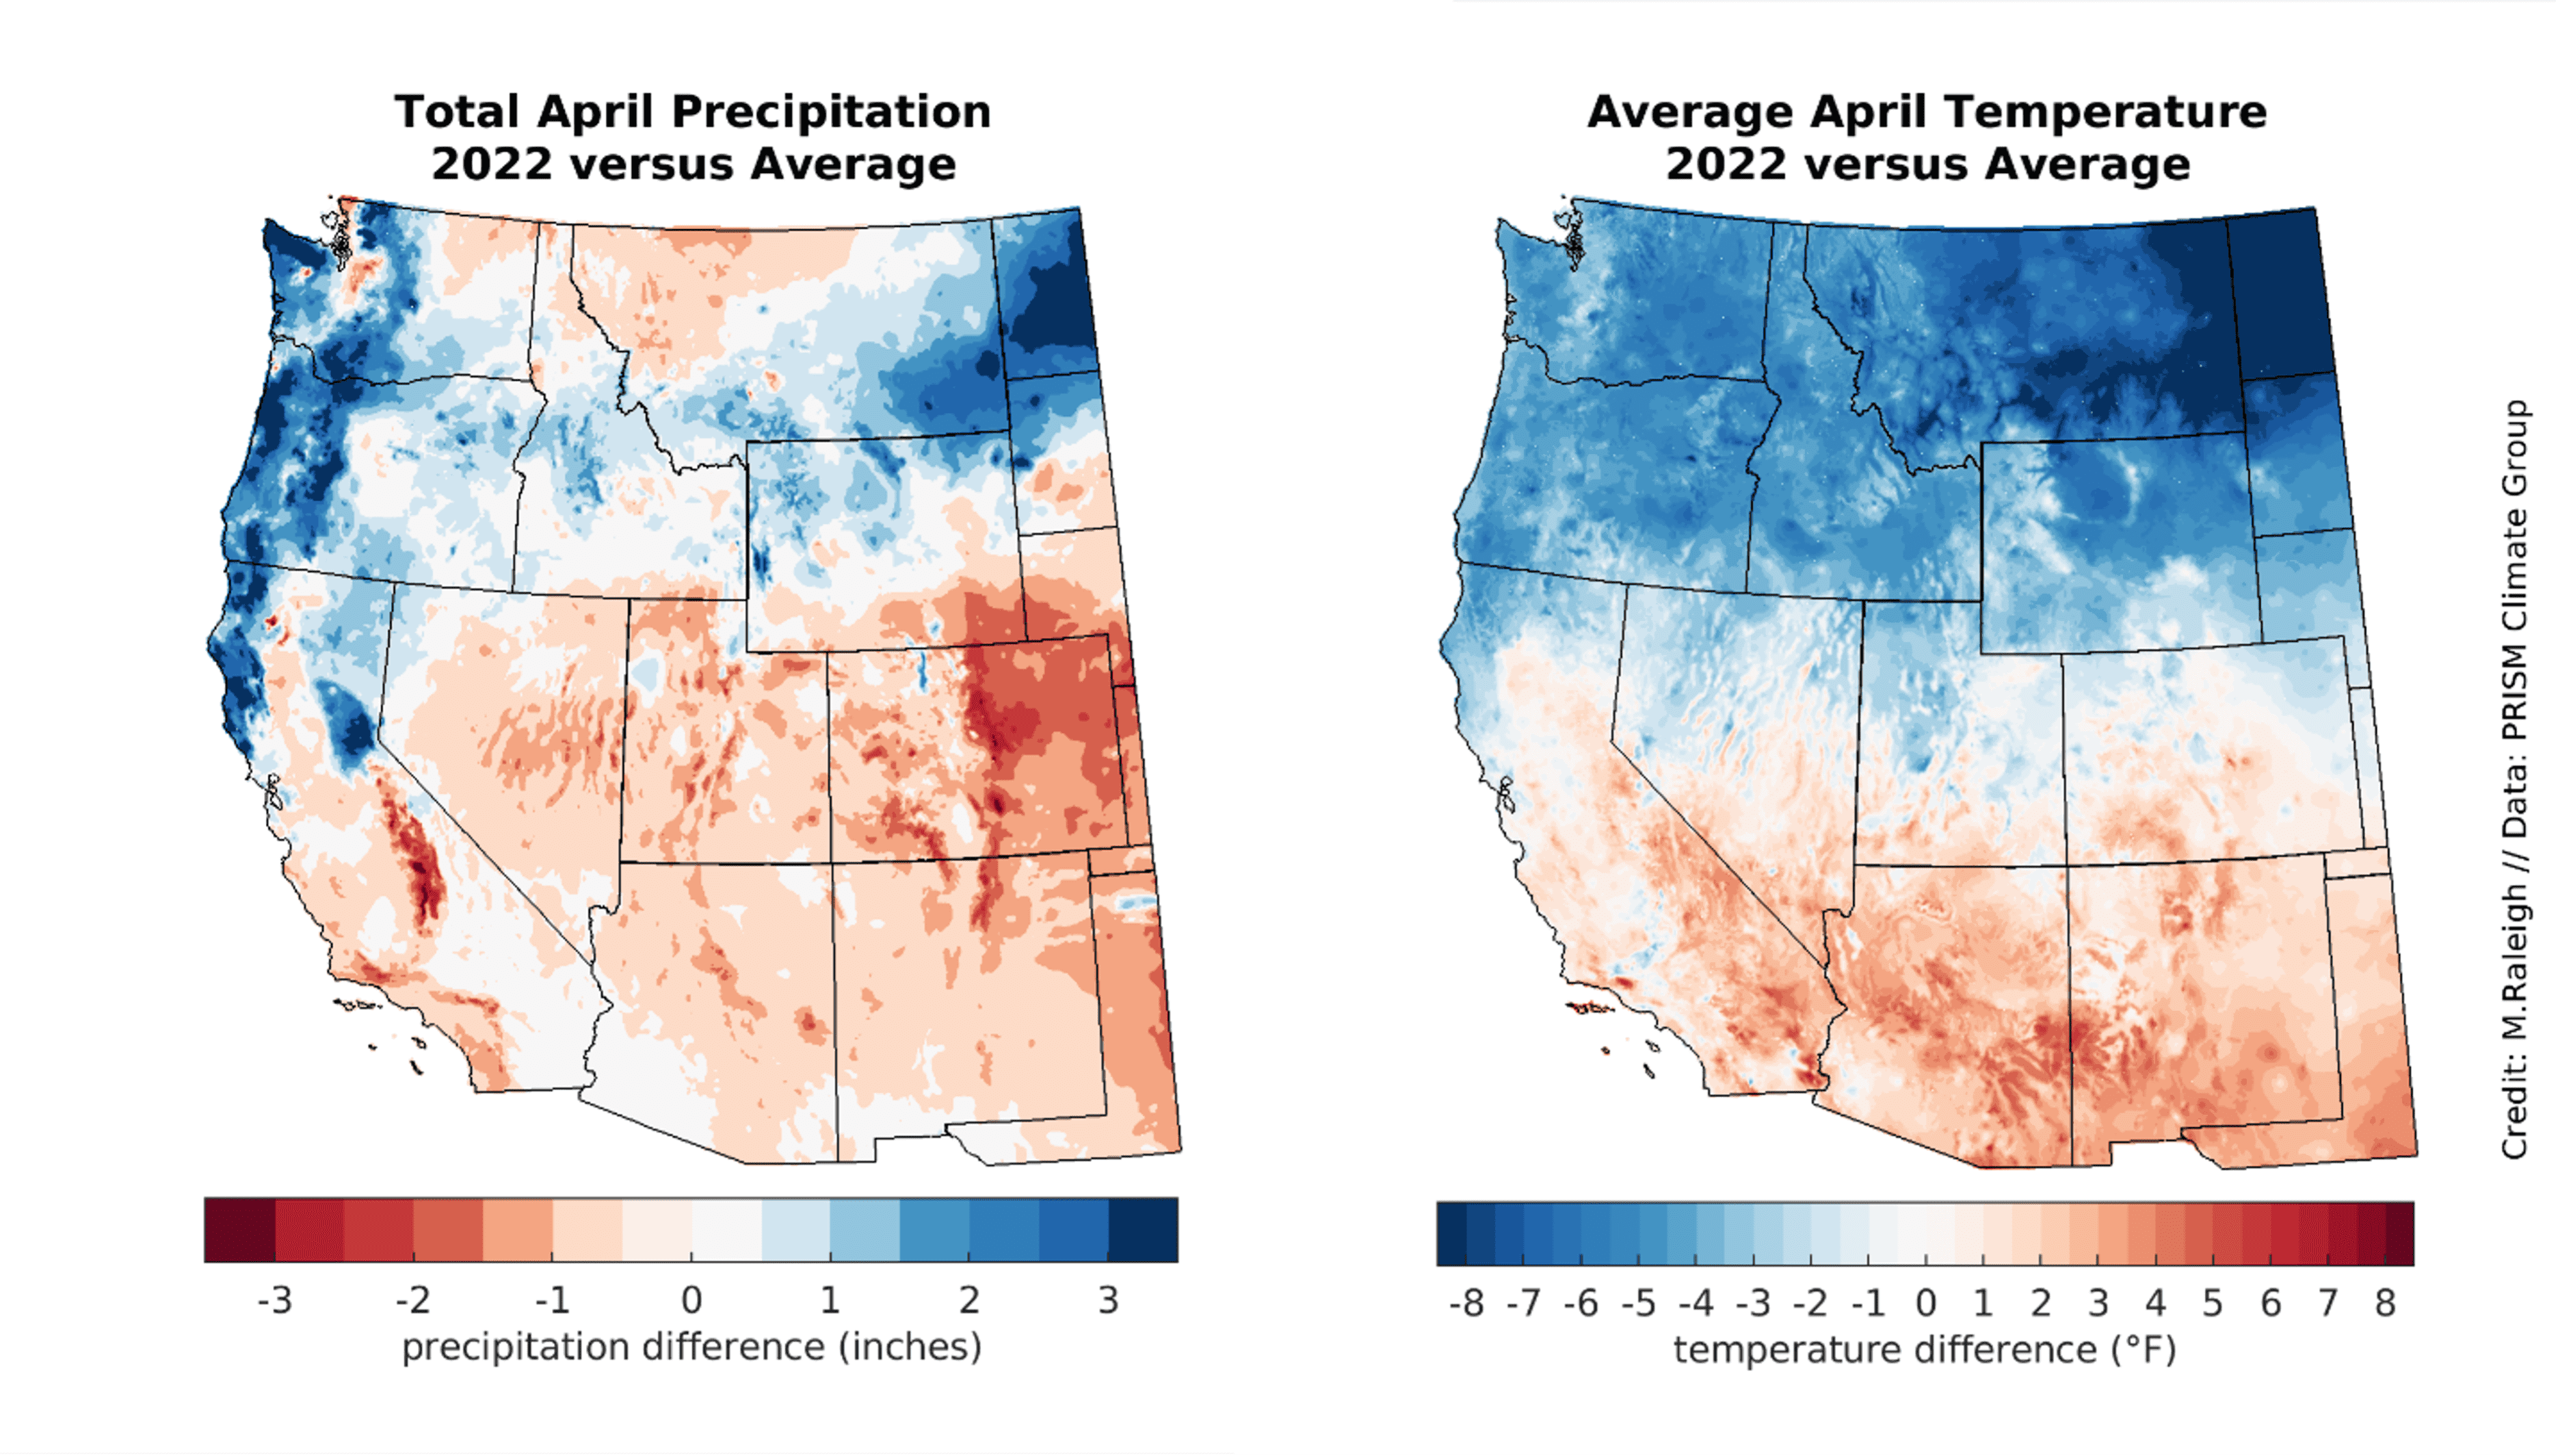
Snow patterns through April 2022 were consistent with regional precipitation and temperature (Figure 6). Relative to the April average over the 1991 to 2020 record, April 2022 tended to be wetter across the Cascades and Coastal Ranges and the northern Sierra Nevada and throughout portions of Idaho, southern Montana, and northern Wyoming (Figure 6, left). By contrast, April 2022 was drier than average in the southern Sierra Nevada of California and throughout Nevada, Utah, Colorado, New Mexico, and Arizona (Figure 6, left). Below-average temperatures in April 2022 were found across much of the region north of roughly the 39.5° parallel (e.g., Reno, Nevada, and Denver, Colorado), with the most significant negative departures found in Montana, Wyoming, and the Dakotas (Figure 6, right). Areas to the south of this zone generally had above-average temperatures for April. These patterns were broadly in line with expectations for La Niña, which is in its second consecutive winter. Forecasts suggest the persistence of La Niña into autumn. This is concerning for summer water supply and fire danger in much of the region. Except for western locales in the Pacific Northwest, the US West is already experiencing varying levels of drought. In some areas near Santa Fe and Los Alamos in New Mexico, early-season wildfires have already started burning while the remnants of the winter snowpack melt and recede.
This post first appeared on NSIDC.org.
One thought on “April Snow Survey: Westwide Snow Cover is 104% Average”