In Spring 2014, we all got excited because El Nino was forecast to be a very strong El Nino. Then they downgraded it to a weak El Nino. Then El Nino didn’t show up at all until mid-March. Crazy.
Now, NOAA is saying that the weak El Nino that finally showed up has a 70% chance of hanging around through our summer and a 60% chance it’ll last through fall and into the beginning 2015/16 ski season.
So, do we need to be paying attention to El Nino again for next ski season? Yep.
NOAA breaks the rest of the details down for us below:
Details on the April ENSO Forecast
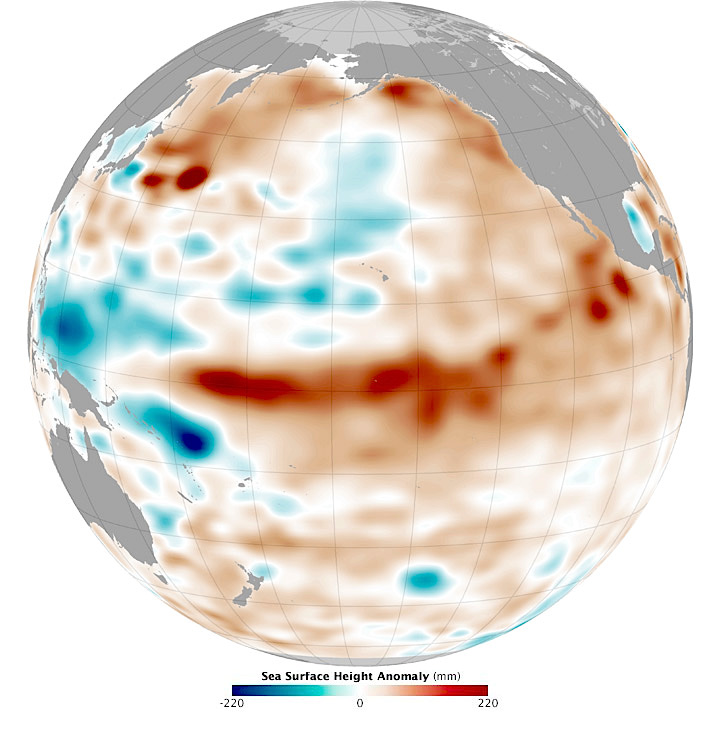
Last month, we saw the first signs of an atmospheric response to the warmer-than-average sea surface temperatures that had been in place in the tropical Pacific for several months, leading us to declare the presence of El Niño conditions. In March, those conditions strengthened a bit. So what are the forecasters thinking this month?
We think the odds are roughly 70% that El Nino conditions will persistent though summer and above 60% that they will last through fall.
Where we are
First, let’s catch up on the details of that atmospheric response. One of the signs that the atmosphere is responding to El Niño’s warmer sea surface temperatures is a westerly wind anomaly near the surface. Usually, surface winds along the equator—the trade winds—blow from the east to the west (“easterly” winds). That easterly flow helps keep warm surface waters piled up in the western side of the Pacific.
When these easterly winds relax, or even turn westerly (blowing from west to east), they often allow some of that warm surface water to move back toward the central or eastern Pacific *. The westerly wind burst during March, show in the top part of the image below, was the strongest since 1997, lasting 9 days**.

Wind (upper) and sea surface temperature (lower) departures from average in the tropical Pacific for March 2015. Purple shading indicates the location of the westerly wind burst. NOAA Climate.gov figure by Fiona Martin, based on Climate Prediction Center data.
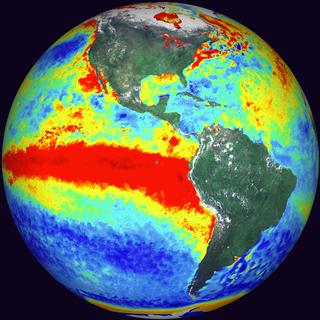
Another hallmark of El Niño conditions is more rain than average in the central Pacific, and less rain over Indonesia. Based on measurements of the amount of longwave radiation escaping from Earth’s atmosphere—an indicator of clouds, which block longwave radiation coming from the surface—this classic El Niño rainfall signal became much clearer during March (see image below).
Blocking of outgoing longwave radiation (OLR) during March 2015. Purple shading indicates greater-than-average absorption of surface OLR (less OLR exiting the top of the atmosphere), showing areas where more clouds than average were present. NOAA Climate.gov image by Fiona Martin, based on CPC data.
More evidence that we’re seeing the weakened Walker circulation characteristic of an El Niño response is given by the March values of the Southern Oscillation Index (-0.7) and Equatorial Southern Oscillation Index (-0.9). These negative values tell us that the consistent rising motion that occurs in the atmosphere over the far western Pacific is reduced (higher-than-average surface pressure), and the connected sinking motion over the eastern Pacific is also reduced (lower-than-average surface pressure).
So that’s where we are…where are we going?
Forecasters give an approximately 70% chance that the surface temperature anomaly in the Niño3.4 region will remain above the El Niño threshold through the summer, and a greater than 60% chance that it will last through the fall. Implicit in this forecast is the expectation that the atmospheric coupling we’ve seen so far will continue. On what are we basing this forecast?
For the short term, there is a substantial supply of warmer-than-average subsurface waters in the equatorial Pacific, in the form of a strong downwelling Kelvin wave. This source of warmth, which increased during March, is likely to help keep surface temperatures above average for the next couple of months.
The strengthened atmospheric response that I described above is also a source of confidence for the forecasters, since it feeds back into the ocean – the classic “coupling” of ENSO or Bjerknes Feedback.
Most of the dynamical models are predicting continued equatorial Pacific surface temperature anomalies above +0.5°, also (see graph below). With the exception of one model, the forecasts are closely grouped, indicating they are fairly confident in the forecast.

Forecast from the North American Multi-Model Ensemble (NMME) for sea surface temperature in the Nino3.4 region. NOAA Climate.gov figure by Fiona Martin, from CPC data.
What are some sources of caution?
As you may recall, in spring 2014 the dynamical climate models were also pretty sure we were headed for a solid El Niño in the second half of 2014, but it did not materialize. We don’t know exactly what caused the overestimate from last year, which makes us treat the models’ current forecasts with some caution. Also, the models historically have a harder time making successful forecasts during the spring (the “spring predictability barrier.”) The statistical models, again similar to last year, are predicting lower ONI than the dynamical models, but they are also subject to the spring barrier.
Also similar to this time last year is the presence of a substantial downwelling Kelvin wave, and strong westerly winds. There are some differences, though, especially in this year’s wind anomaly, which was a little stronger, occurred a little later, and extended a little further east.
If the conditions were exactly the same as last year, our forecast probabilities might be less confident. However, conditions are not the same as this time last year. The Oceanic Niño Index (ONI) for January-March 2015 is more than 1°C warmer than for the same period in 2014, meaning we are starting off from a warmer base state than last year. It’s important to note that this doesn’t necessarily translate to a warmer outcome later this year, though.
What’s the bottom line?
As Michelle discussed in her recent post, it’s way too early to know with 100% confidence if we will see a strong event, or even if El Niño will continue into this coming winter—the time of year when ENSO exerts its greatest influence on global precipitation and temperature patterns. The atmospheric coupling would need to continue, especially the persistence of westerly wind anomalies, which we did not see last year.
However, the combination of current conditions with model forecasts leads us to giving a 60-70% chance that El Niño will continue through the summer and into the fall.
* We call them westerly wind anomalies when the winds are “less easterly” than average, even if they are still easterly on the whole.
** Based on analysis done by Phil Klotzbach of Colorado State University, focused on the region 5S-5N, 155E-180. The westerly wind burst exceeded 5 m/s from the daily average from March 4-12 (nine days), peaking at 7.4 m/s on March 8 in this region. This is the longest period that a westerly wind burst has existed since 1997 in that region, as well as the strongest magnitude for any given day since 1997.