We’ve all been there. Your friend told you the resort was supposed to get over a foot of snow overnight. You check your phone, and your weather app shows a little snow icon. It must be true! Your skis are all waxed up and ready to go, and you wake up well before sunrise to be one of the first skiers at the resort only to find less than an inch of new snow on the ground. How could this have happened? Where is all the deep fluffy pow you were promised? Is there a better way to forecast snow?
This article is going to take a look at some of the best freely available weather tools and show you how to use them to make your own snowfall predictions.
The main tools that we are going to use in this article are derived from Numerical Weather Prediction (NWP) models computed by NOAA, which makes the data freely available. We will use a couple of different free tools to visualize data from these weather models, namely SpotWx and the University of Utah Weather Center. One theme throughout this article will be the importance of a converging forecast. Current weather models do a great job of forecasting 2-3 days in the future and a decent job of forecasting up to 10 days in the future. The way weather models work causes errors to become larger and larger as the forecast window is extended. So while the 10-day forecast may give us an idea of when storms may be on their way, we will track the forecast as the snowstorm gets closer, and wait until it is just a day or two away to make quantitative predictions.
To illustrate the usage of some of these tools, I will be tracking the arrival of the recent atmospheric river event that brought 36 inches to Timberline, OR, 33 inches to Steamboat, CO, and 48 inches to Alta, UT. Since Bogus Basin, ID is my home mountain, and relied on this storm to open a bunch of new terrain, I will use it as our forecast location. All of the tools I will discuss can be easily adjustable to fit your home mountain!
I started tracking this storm on Monday (11/27) by looking at data from the Global Forecast System (GFS) on SpotWx. The GFS is a 10-day forecast with moderate spatial resolution. To access data from the GFS using SpotWx, simply open the website, click the location you wish to forecast for on the map, then pick GFS from the list of models below (I found the GFS second to the bottom in my list of models). Here is the precipitation forecast for Bogus Basin from the GFS on Monday:
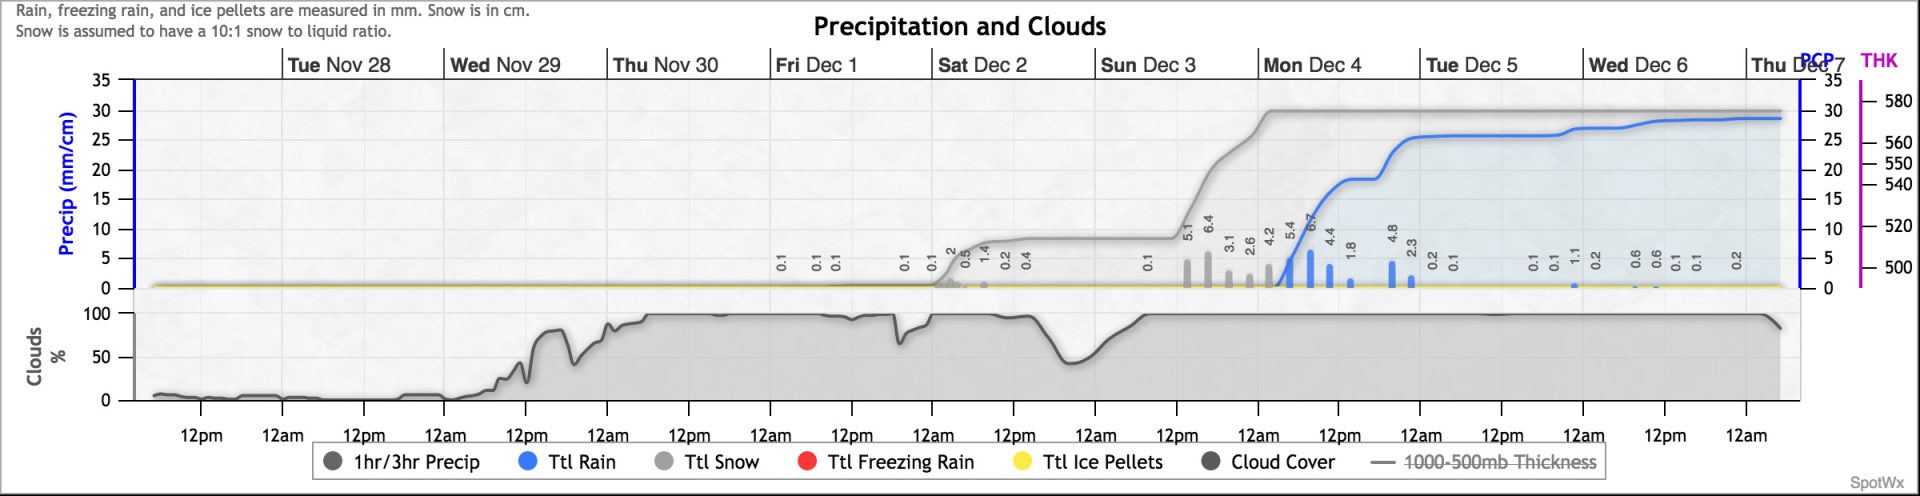
It looks like we could start to see snow (gray line) Friday night or Saturday morning. The storm will last through Monday but eventually turn to rain (blue line). So at this point, it looks like it could be a snowy weekend with the potential for deep totals!
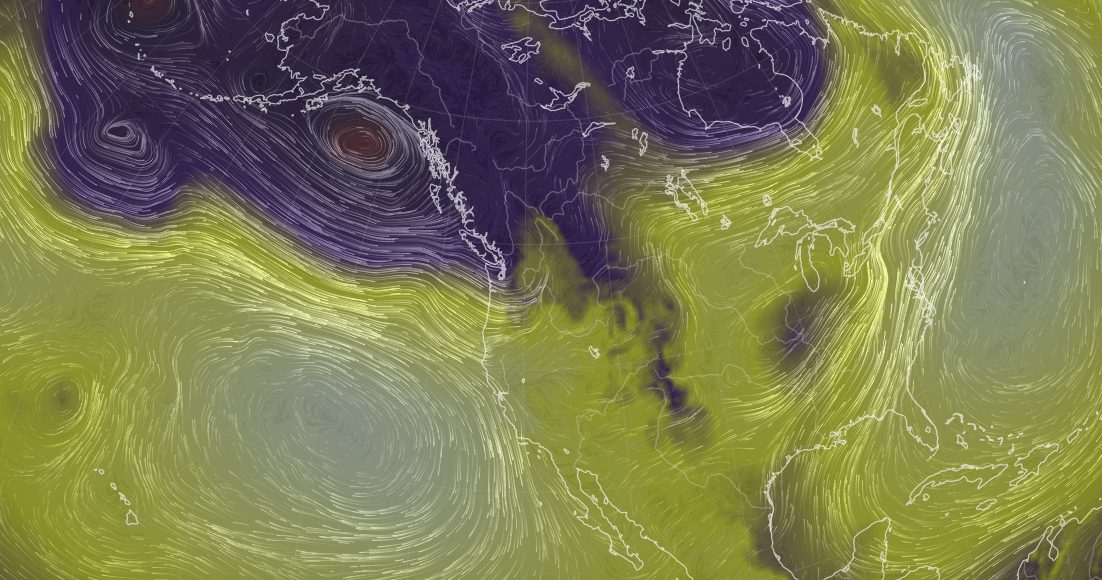
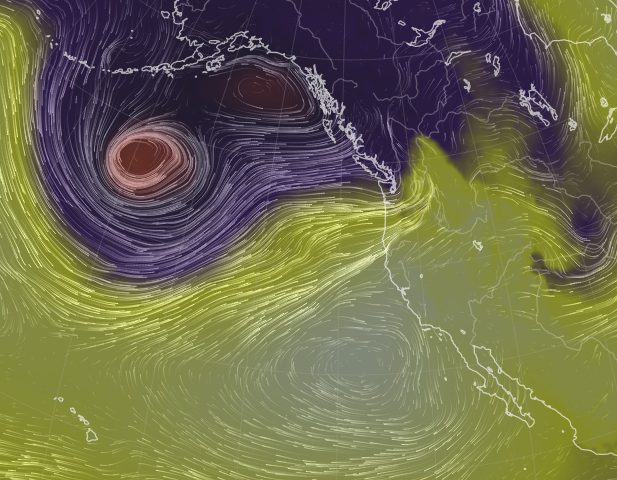
Where is this storm coming from? Below is a colormap of the mean sea level pressure with the wind speed and direction drawn over the top of it as white lines. This image is from earth.nullschool.net, also using data from the GFS model, and is a forecast for the weather on Friday (12/1). Storms are shown as darker colors. We see a huge storm off the coast of Alaska and extending into British Columbia with winds that should carry both cold air and moisture through the Pacific Northwest and hopefully to the Boise Mountains and Bogus Basin.
For the rest of the week, we just keep an eye on these medium range forecasts. Though the GFS and other 10-day weather models will predict snowfall totals, we will rely on quantitative prediction from much shorter timescale weather models, namely the three-day North American Mesoscale Forecast (NAM) and the 18-hour High Resolution Rapid Refresh Forecast (HRRR).
On Thursday (11/30) we are now to the point where 3-day models, with higher resolution and greater accuracy, are beginning to capture the first part of this storm. Data from these models can be accessed from SpotWx by selecting a different model from the list, instead of the GFS. At first glance, there is general agreement with the longer-term forecasts we have been looking at. However, it looks like temperature will be a bit of an issue for this storm. The NAM (shown below) predicts that snow should start to fall early Friday morning, with up to four inches falling by the evening, but temperatures will begin to climb right as the moisture really starts to roll in. This likely means cascade concrete for most of Saturday and Sunday, eventually turning to rain sometime Sunday night.
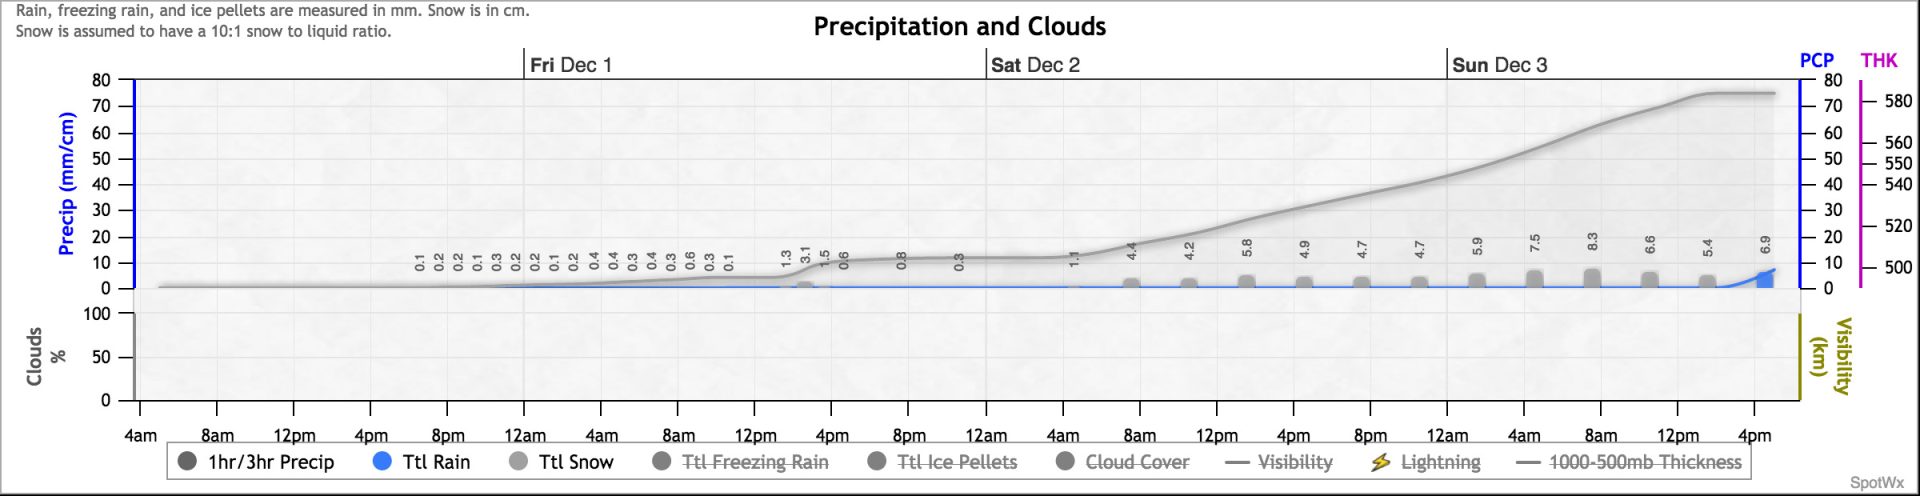
Shown above is the precipitation prediction from the NAM model for Bogus Basin made on Thursday. We see now that the storm should start to roll in Friday morning, with snowfall really picking up on Saturday morning, with rain starting Sunday night. The NAM also gives us predictions for what elevation the freezing level will be:
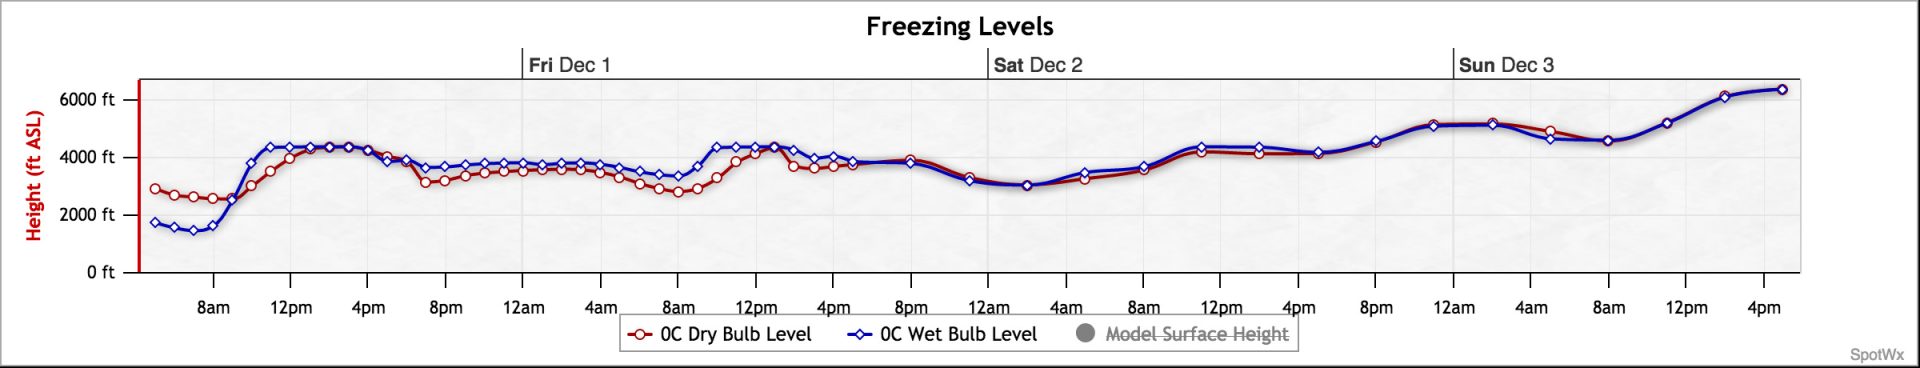
The snow stake at Bogus Basin sits at an elevation of 6,340 feet, so based on the plot above, we could predict rain to arrive sometime around 2-4 pm on Sunday. Though, this timeframe is at the tail end of the forecast window, so we will have to double-check this prediction on Friday and Saturday.
Based on the forecast data shown above, I made the prediction of 3 inches on Friday, 9 inches on Saturday, and 4 inches on Sunday before the rain starts. These numbers are slightly less than what comes straight out of the model because weather models often use a much higher snow-liquid ratio to predict snowfall totals, and I know that the snow at Bogus Basin is typically much wetter (meaning a lower snow-liquid ratio). One of the best things you can do to improve your own forecasts for your home area is to build up an understanding of what weather patterns are common in your area. The NOAA Forecast Discussions are a great quick way to start to understand where some of these weather patterns come from.
Starting on Thursday night, the first half of the storm is in the range of the HRRR model, which has the highest spatial resolution and thus should give the best forecast for Bogus Basin, instead of the greater Boise Mountains. Below are some predictions for Bogus Basin from the HRRR, plotted using this website from the Steenburgh Group at the University of Utah Department of Atmospheric Sciences. To access these data, navigate to the HRRR Snow Time Series webpage and enter the latitude and longitude coordinates for the location you are interested in. If you don’t enter a date, the website will pull the most recent available data. Note that it takes a few minutes to generate the plots, so be patient!
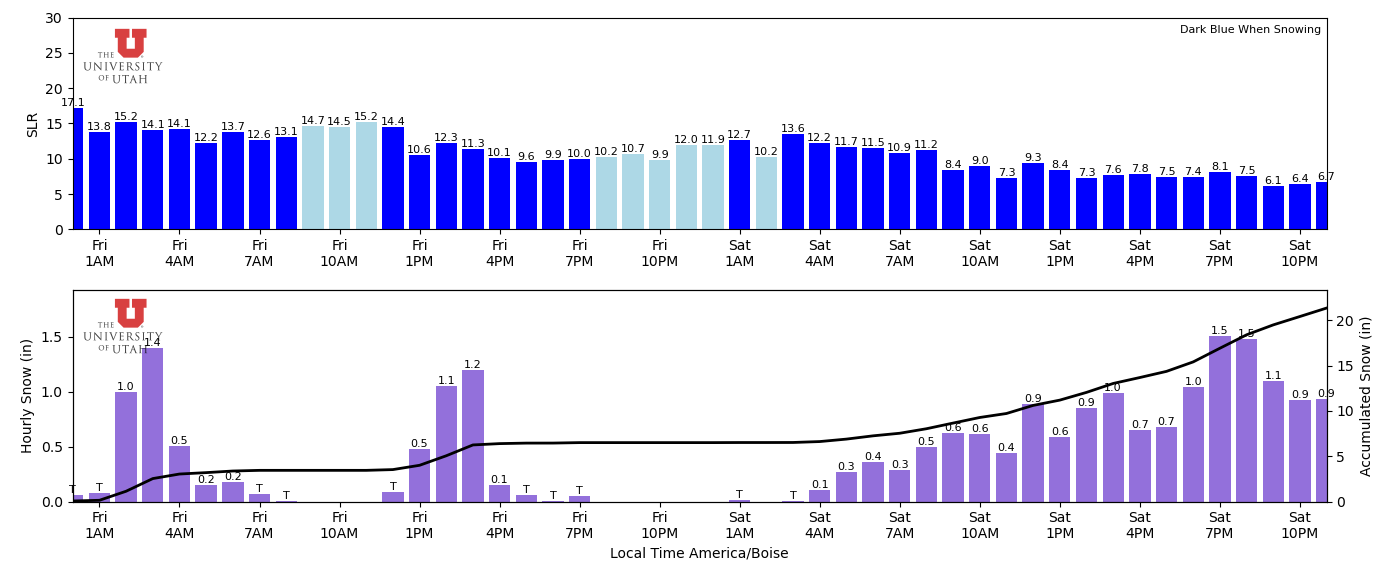
Looking at the bars in the bottom graph (hourly snowfall), we can expect it to snow between 2 and 7 am Friday morning, then again Friday afternoon. The snow then picks up again all day Saturday, with perhaps up to 20 inches accumulated between Thursday night and Saturday night (black line in lower plot, read off the scale on the right).
Friday morning brought 3 inches to the snow stake at Bogus Basin, and also brought the later part of the storm in range of the HRRR. Below is a similar plot of the snowfall predictions:
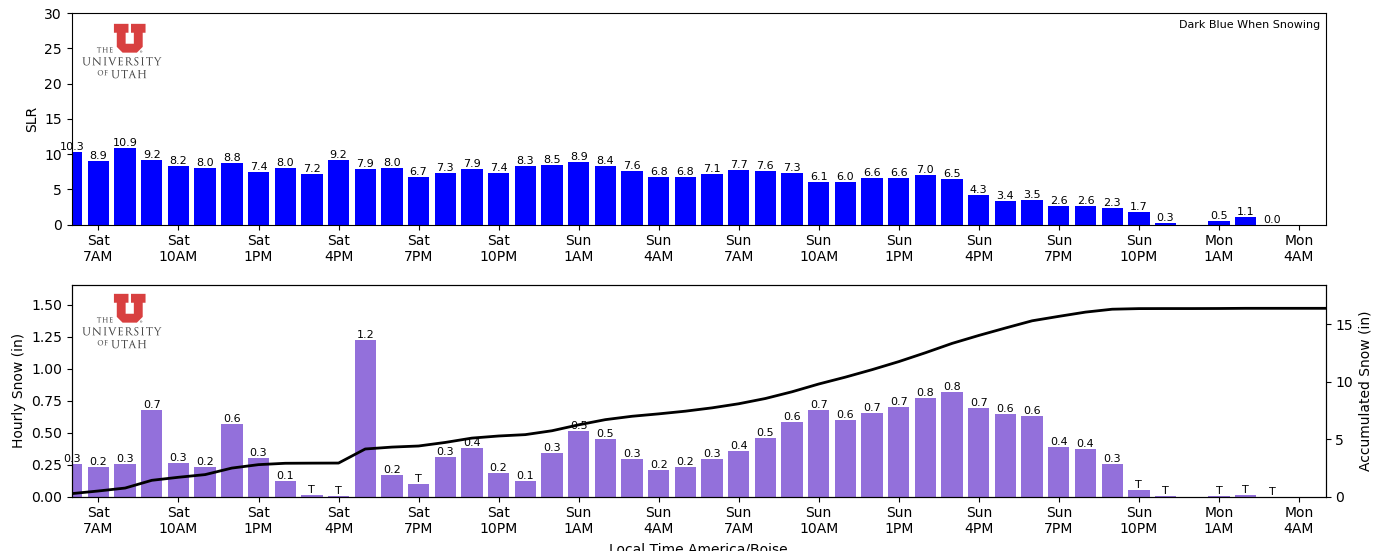
We see that the new HRRR predictions no longer call for extensive snowfall on Saturday night, which will drastically cut down on totals. The snow-liquid ratio will drop to essentially rain levels Sunday afternoon. Luckily, the precipitation should all stop by Monday morning, so hopefully there isn’t too much rain to wash away the snow.
Turning to earth.nullschool.net again, we find the reason for this warmup. The wind patterns are forecasted to change, bringing warm air into the region from Hawaii. This weather pattern is sometimes called the “Pineapple Express.”
What happened in the end? Bogus Basin received 5 inches on Friday, 6 inches on Saturday, and only 4 inches on Sunday. The rain wound up coming in around 1 pm on Sunday afternoon, resulting in lower snow totals and more melting. Still, Bogus Basin was able to open two chairlifts and a handful of runs, and the skiing wasn’t all that bad! Because of the temperatures during this storm, I never expected blower pow, but was pleased that it didn’t all fall as mashed potatoes.