“The 1997-1998 El Niño was distinguished by record-breaking warm sea surface temperature anomalies in the equatorial east-central Pacific Ocean. So far in 2015, increasing equatorial warmth is developing alongside a positive Pacific Decadal Oscillation, characterized by persistently higher sea surface temperature anomalies of the northeastern Pacific.” – NOAA
NOAA just released this visual comparison of the 1997 El Nino (the strongest on record) side by side with the current El Nino that could potentially develop into the strongest El Nino on record.
The main difference you see when you look at these two maps is that the Eastern Pacific near California and western Canada is much warmer this year verses 1997’s El Nino.

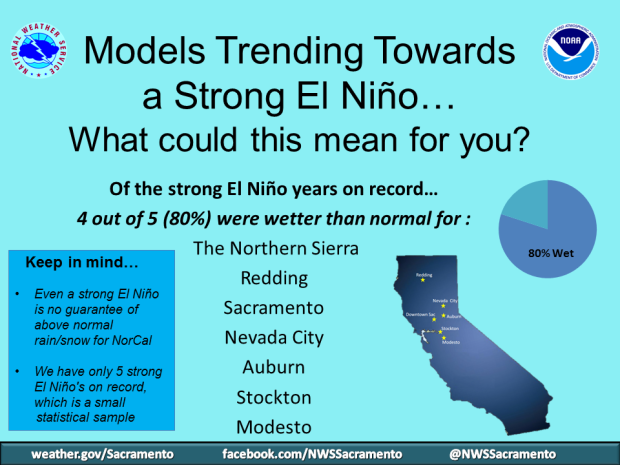
The strong El Nino currently developing in the Pacific ocean is forecast to bring above average precipitation to California, Arizona, south Colorado, & New Mexico with above average precipitation forecast.

The strong El Nino for 2015/16 forecast looks bad for the Pacific Northwest, Montana, Wyoming, and Idaho with below average precipitation forecast and well above average temperatures forecast.

4 out of the 5 El Nino’s on record in California have dropped above average precipitation in California.

Weird lookin photo enhancement in the first image !