This post first appeared on the climate.gov ENSO blog and was written by Michelle L’Heureux
I want to kick off this blog post by introducing you to a force of nature in the climate community, Geert Jan van Oldenborgh. He just got recognized by the European Meteorological Society with a Technology Achievement Award for building the KNMI Climate Explorer. This website, which you can access at https://climexp.knmi.nl/, is a great way to plot and play with climate data. Give it a whirl!
Geert Jan isn’t just a talented web programmer and data manager—he is also a prolific climate scientist who has been working with me and several of our colleagues on a matter of increasing importance. Our collaborators include the Bureau of Meteorology in Australia (BOM), European Centre for Medium Range Weather Forecasts (ECMWF), and the international Red Cross Red Crescent Climate Centre.
Global warming has become increasingly prominent in our ocean temperature datasets. It is difficult to look at a map of sea surface temperature (SST) across the globe and not see that global maps are often awash in red color, reflecting above-average temperatures. This includes the tropical Pacific Ocean, where differences from average sea surface temperature (or SST anomalies) are the key ocean indicator for El Niño (warmer) and La Niña (cooler).
At the Red Cross Red Crescent Climate Centre, these tropical Pacific sea surface temperature anomalies are tracked using the Niño-3.4 index (or the Oceanic Niño Index (ONI), which is the seasonal average of Niño-3.4). This index, or time series of ENSO variability, is used as an early warming indicator for El Niño and La Niña- related climate disruptions that might require humanitarian aid. They realized that the presence of global warming in SST-based ENSO index may be resulting in over or under-preparation for unusual rainy seasons (you can read more about this in Geert Jan’s open-access article).
All warming is not equal
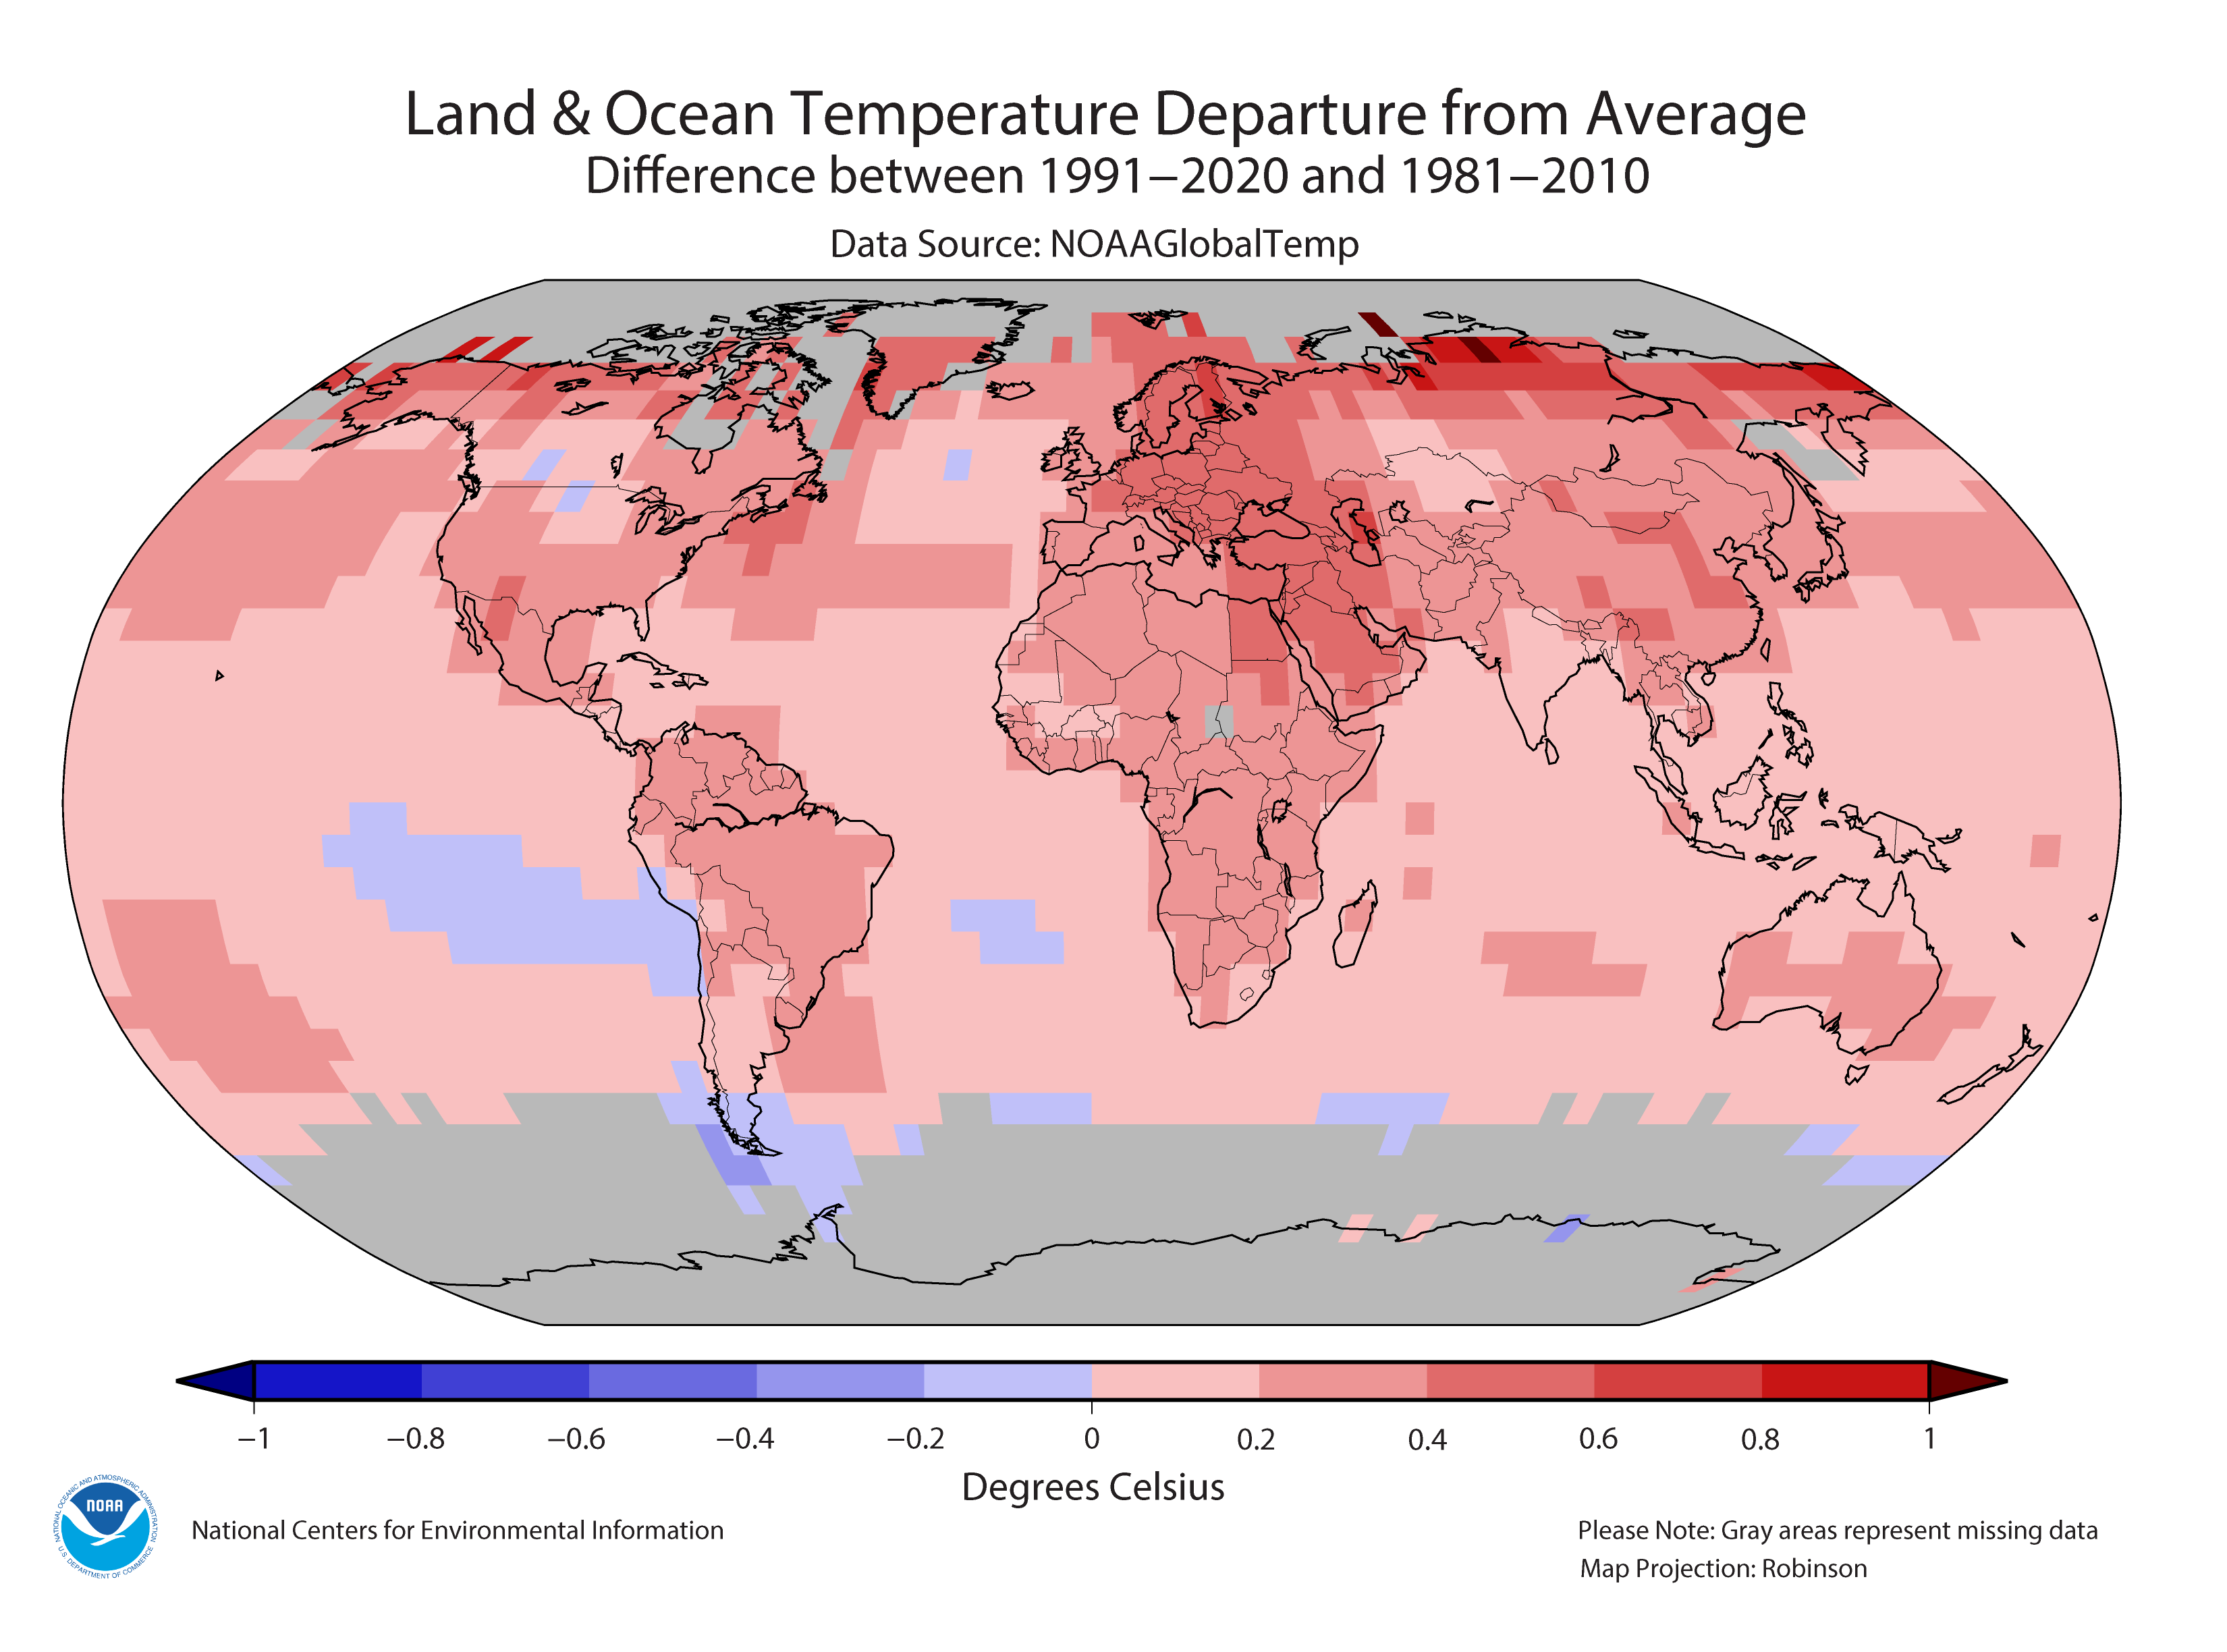
For monitoring ENSO, everything depends on how conditions compare to average. But what does “above average” temperatures actually mean? Well, until recently, it meant relative to the average of ocean and atmosphere conditions over the 30-year period from 1981-2010. But every ten years, NOAA and other agencies update the averages to a period that is closer to the present. So, now we’re using 1991-2020. Across much of the planet, the newer base period average is often warmer than the older one thanks to global warming (but not everywhere, or for every season). Check out this graphic that our friends at NCEI have put together!
Updating the averaging period helps us keep pace with changes over the last decade, but as it turns out, a climatology based on the last 30 years can still be a little dated as far as ENSO is concerned. Why is this a special problem for ENSO? Because the short-term, localized temperature changes that occur during El Niño and La Niña events have a different impact on the global climate than the long-term, all-over warming caused by rising levels of atmospheric greenhouse gases. In other words, not all warming is equal. So we don’t want to be mixing up the two when we measure ENSO. It can be confusing!
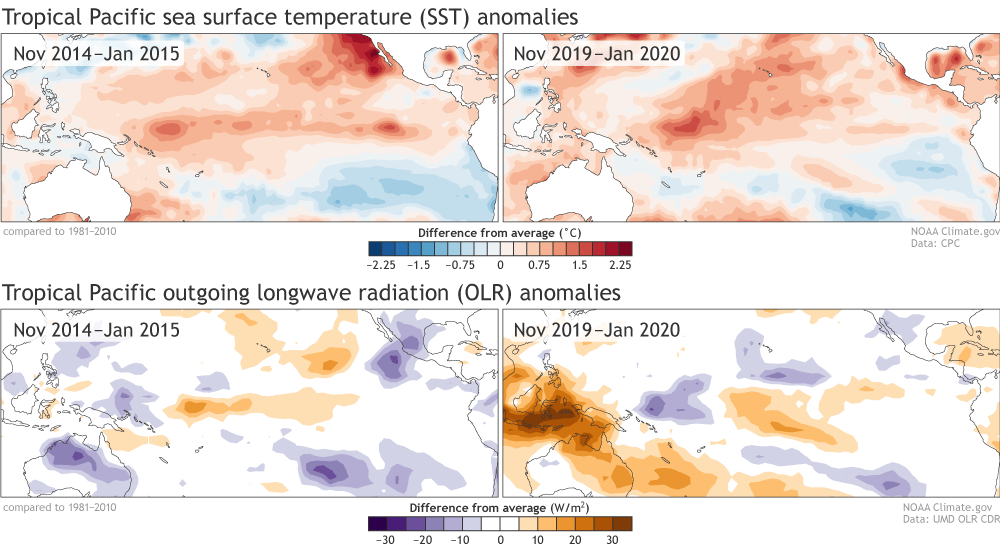
To give a concrete example, remember the not-so-distant winter of 2019-20? Well, Emily Becker still has flashbacks because she had to do a monthly dance to explain why positive values in the Niño-3.4 index and above-average SSTs can look like El Niño across the tropical Pacific Ocean, but actually were not El Niño. Why not? Mainly, the patterns of tropical convection and winds were not matching up with the SST pattern. And because ENSO is a coupled atmosphere-ocean pattern, we need the atmospheric circulation to lock in and persist (this is part of our ENSO Alert System). It was a close call, but we just didn’t see what we needed to declare El Niño in 2019-20. We had a similar problem in 2014-15 when SSTs were above average for certain seasons, but it was not reflected in the atmospheric circulation.
So what can we do about it?
Geert Jan and Harry Hendon were chatting one day and realized that ENSO monitoring could be better handled by using relative sea surface temperature anomalies (footnote #1), taking the anomaly in the Niño-3.4 region and subtracting the anomaly for the entire tropics. Turns out removing the tropics-wide anomaly helps shine a bigger spotlight onto the local regions of relative warming or cooling that are more directly tied to locations of enhanced or suppressed tropical rainfall.
This works because in the tropics, changes in rainfall are more sensitive to the differences (or gradients) in temperature across the surface of the ocean. Where waters are warmer relative to the tropical average, there is more rising motion, increased cloud formation, and rainfall than where waters are relatively cooler, sinking, and drying (same principle as why your basement tends to be cooler and your attic warmer—see footnote #2 for the Finnish equivalent).
So, for determining the location of where tropical rainfall increases or decreases, it doesn’t matter as much that the global tropics are gradually warming up as it does the existence of relatively cooler or warmer temperatures on the ocean surface. Because coupling between the atmosphere and ocean is linked to tropical rainfall changes, relative SSTs help us better identify those regions that are more closely tied to shifts in the atmosphere and coupling that are fundamental to ENSO!
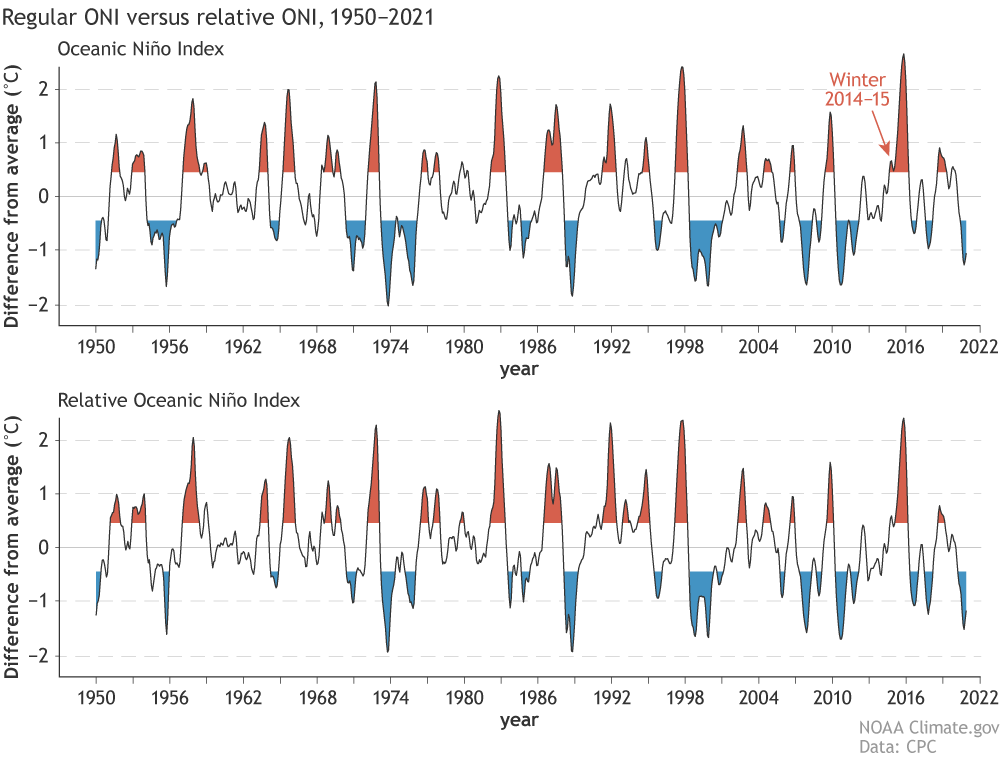
Getting back to our 2019-20 “False positive El Niño,” the relative SST index clarifies this situation and shows that the tropical Pacific was more in line with ENSO-neutral. The same is true for 2014-15 when there was a lack of SST gradients and corresponding changes in the atmospheric circulation and rainfall that were missing. The relative ONI simply does not identify those periods as El Niño (footnote #3).
Not only does relative ONI help reduce the amplitude of warm Niño3.4 conditions by removing an unrelated and therefore unwanted contribution from global warming, but it also strengthens some recent La Niña events that would have otherwise been considered stronger if not for the presence of climate trends (2016-17 and 2017-18).
Going forward, you can count on the NOAA/IRI ENSO team to also take in account the relative ONI when updating the current ENSO status. For now, the current ONI table will remain as is, mostly because our model forecast guidance is also in terms of non-relative anomalies. But don’t be surprised if you start seeing relative SSTs more often in the future!