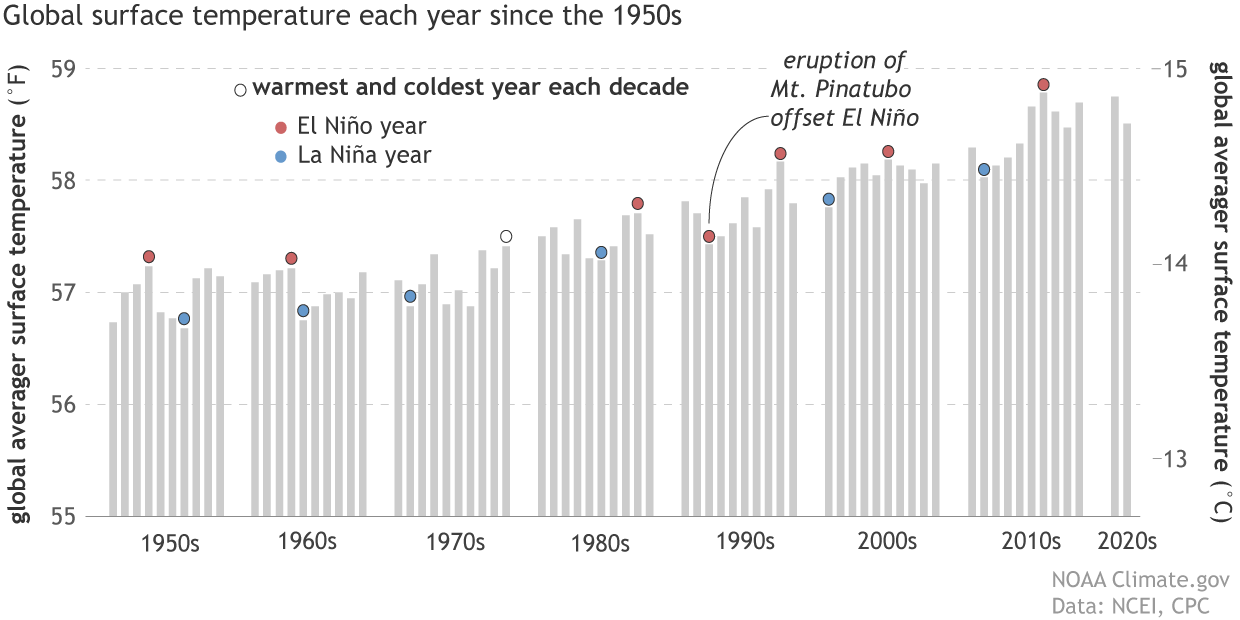
Here at the ENSO blog, we’ve been talking about La Niña (the cool phase of the El Niño-Southern Oscillation climate pattern) for going on three years now. People have started to tell us they’re bored ask us whether all these La Niñas could offset global warming.The short answer is no, La Niña is no match for global warming. (Footnote 1)
The simplest evidence is that global average temperature during recent La Niña years is warmer than for El Niño years in earlier decades! In fact, the La Niña year of 2020 tied 2016—a year that started with a major El Niño—as the all-time-record-high global surface temperature.
But if global warming continues year after year regardless of La Niña, then how does the surface temperature manage to cool off at all during La Niña? Where does that excess heat go? We last covered this topic back in 2014 (Can you believe the ENSO Blog is that old?!), so we thought we’d ask a group of experts to revisit it with us in this week’s blog.
We posed these questions to previous ENSO blog contributors Mike McPhaden and Richard Allan, and Shang-Ping Xie. Mike is an oceanographer and ENSO expert at NOAA Pacific Marine Environmental Laboratory. Richard is a climate scientist at the University of Reading. Shang-Ping is a climate dynamicist at Scripps Institution of Oceanography, UC San Diego. Climate.gov’s Rebecca Lindsey and Tom Di Liberto wrote the introduction and lightly edited their responses.
When we look back over the historical temperature record, we see that the warmest years in any decade are usually El Niño years and the coldest years are usually La Niña years. Why is that?
Mike: These images provide a clue.
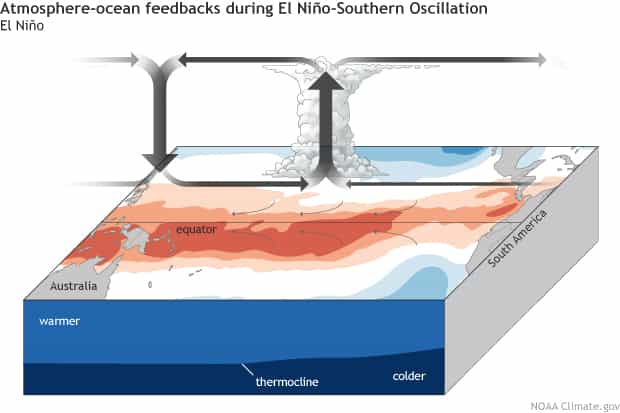
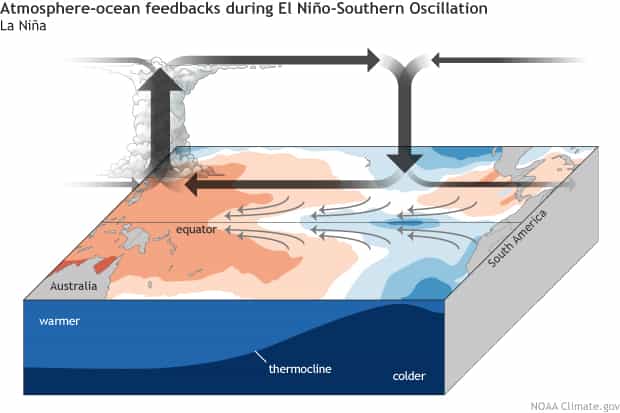
During El Niño, unusually warm sea surface temperatures in the central/eastern tropical Pacific lead to increased evaporation and cooling of the ocean. At the same time, the increased cloudiness blocks more sunlight from entering the ocean. When water vapor condenses and forms clouds, heat is released into the atmosphere. So, during El Niño, there is less heating of the ocean and more heating of the atmosphere than normal. During La Niña, the opposite happens. With colder La Niña sea surface temperatures, there is less evaporative cooling of the ocean, less convective cloudiness blocking the sun from heating the ocean, and less convective heating of the atmosphere.
So, the atmosphere warms more during El Niño and less during La Niña, and that affects global average temperature. We have found that for every degree Celsius of El Niño warming in the central equatorial Pacific (or the Niño 3.4 region, to be precise), the global average surface temperature rises by 0.07°C (0.13 ˚F), with a delay of 2-3 months. Similarly, for 1°C cooling during La Niña, global average surface temperatures drop by about 0.07°C. It may not sound like much, but it involves huge transfers of heat between the ocean and atmosphere that affect the entire globe.
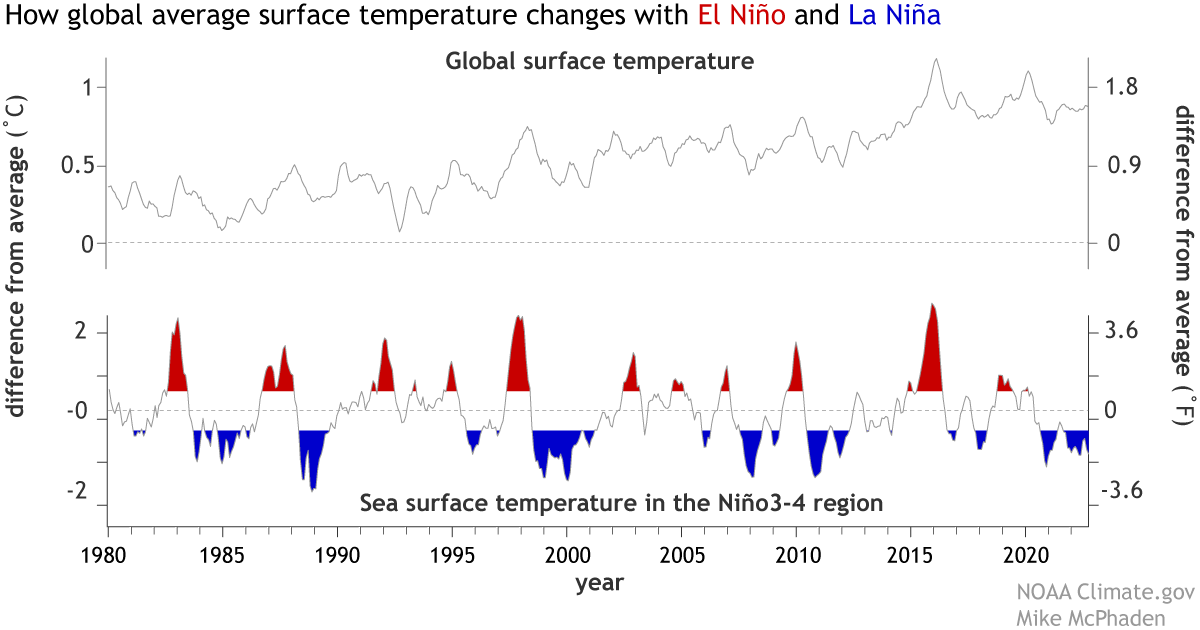
Shang-Ping: During La Niña, the surface cooling of the equatorial Pacific is due to the intensified trade winds that upwell cold water from beneath. This causes major shifts in atmospheric convection (heavy tropical showers and thunderstorms) and circulation. These changes in tropical convection also induce large atmospheric waves with horizontal scales of thousands of miles that communicate the La Niña effect to the rest of the tropics. As a result, La Niña causes the rest of the tropics to cool—both over the oceans and on land.
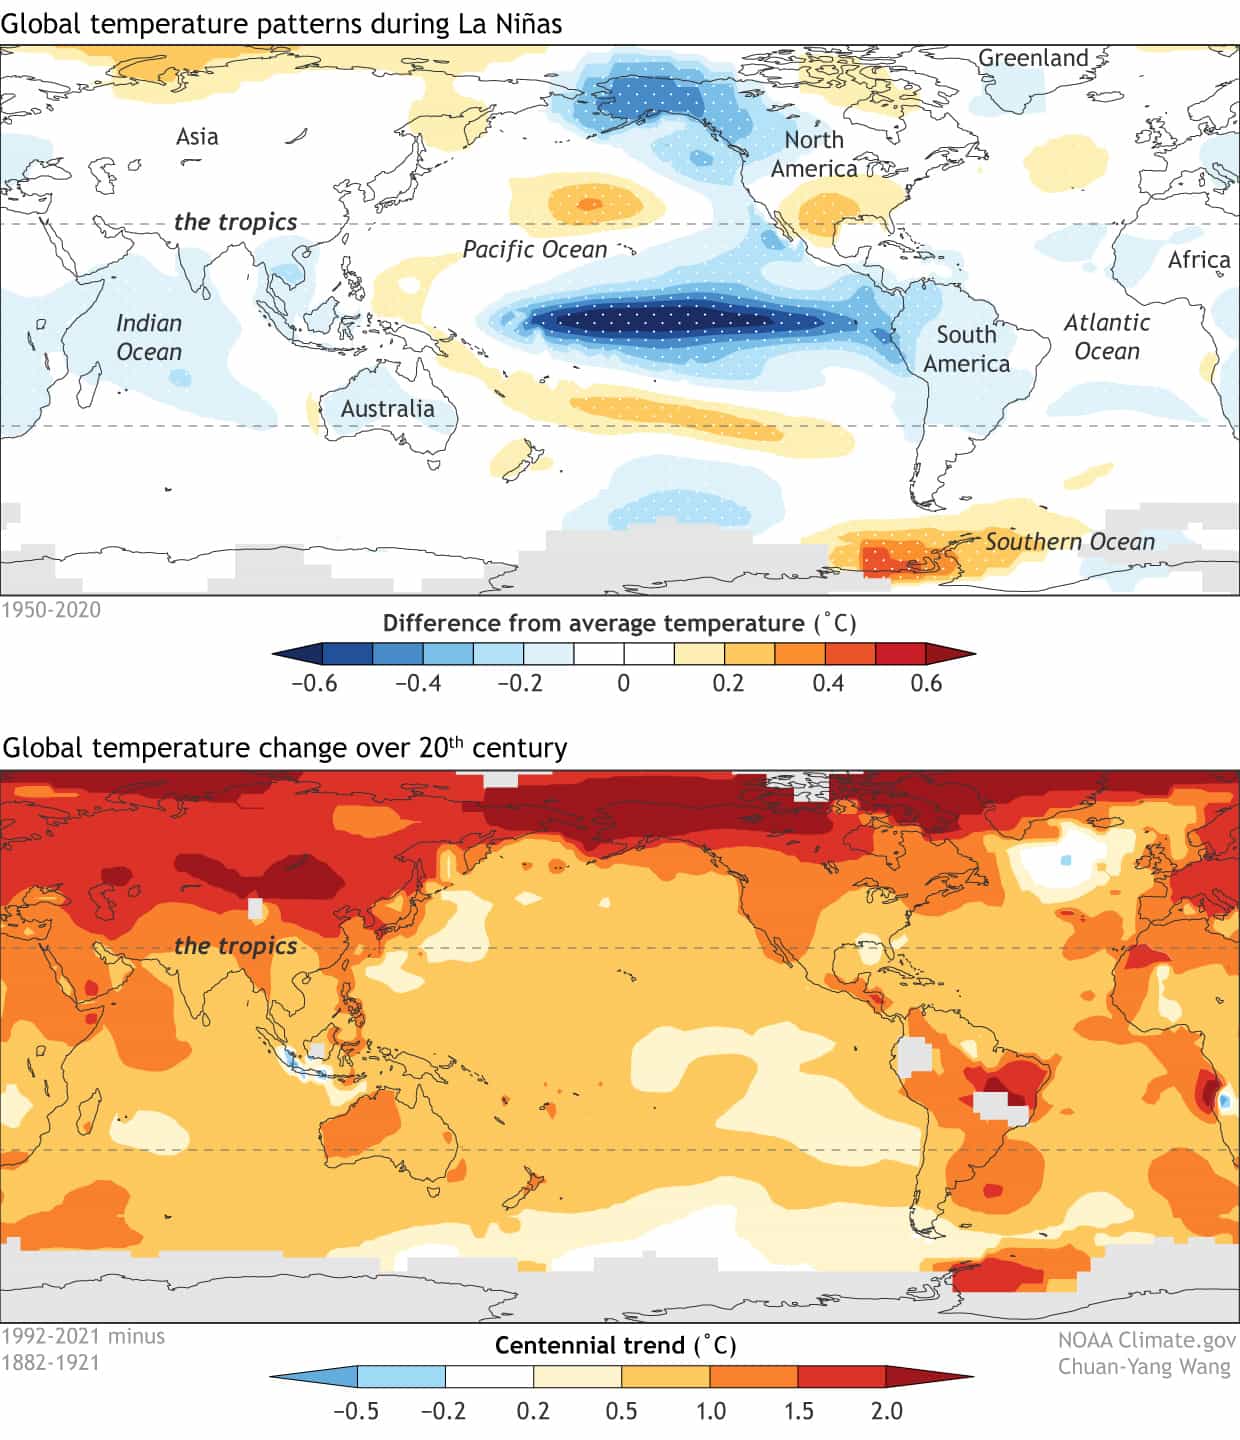
Outside the tropics, the atmospheric circulation change during La Niña (footnote 2) causes warming over much of the North Pacific and cooling over Alaska and western Canada, but the surface temperature effect is small when averaged over the globe outside of the tropics. Thus, the La Niña contribution to global-average surface temperature is mostly from the tropics.
In the big-picture sense, Earth’s average global surface temperature is determined by the balance between incoming sunlight and outgoing heat energy. Are the temperature changes we see during La Niña and El Niño the result of a change in the planetary energy balance?
Richard: No. In El Niño years, the warmer oceans in the tropical Pacific heat the atmosphere above, mostly through evaporation and condensation of moisture in clouds, and this eventually causes more heat loss (infrared radiative energy loss) to space. [As Mike and Shang-Ping describe in Question 1, there are more clouds in the central tropical Pacific during El Niño, which block incoming sunlight and further reduce surface heating.]
This means there is temporarily less energy arriving than leaving the planet following El Niño. We’re talking about a few months lag between the temperature changes in the eastern tropical Pacific and the global responses in the planetary energy balance. The reverse takes place in La Niña. This gives us a heavy hint that ENSO drives a change in Earth’s energy budget, not the other way around, since warm events are generally associated with less planetary heating, and cool events are associated with moreheating.
Shang-Ping: What Richard said is very important: La Niña drives, instead of being driven by, a planetary energy perturbation. The oscillation between El Niño and La Niña involves the redistribution of the warm water volume (the upper ocean above the thermocline) in the tropical Pacific Ocean. The surface cooling of the equatorial Pacific results from increased upwelling of the cold water from the thermocline; it’s not the result of the planet absorbing less energy.
In contrast, anthropogenic [human-caused] global warming results from extra heat that the increased greenhouse gases trap in the climate system. Since these gases are uniformly distributed in the atmosphere, they cause surface temperature to rise everywhere.
Satellite and ocean observations show an increase in energy building up every year as greenhouse gas concentrations continue to rise*, even through periods when the rate of surface temperature increase slows. That’s largely because the deeper layers of the ocean are storing much of the excess heat. What do we know about where/how the ocean stores this heat?
Mike: On the seasonal and year-to-year time scales that characterize ENSO variations, it is the upper few hundred meters of the ocean that matter most for the storage, transport, and exchange of heat with the atmosphere. The tropical Pacific is the main center of action on these time scales, though there is a partial compensation of tropical heat gain and loss from opposite tendencies at higher latitudes. For example, during El Niño the tropical Pacific experiences a large heat loss to the atmosphere as noted above, but some of that heat is reabsorbed into the ocean at higher latitudes because of El Niño teleconnections.
On longer decadal time scales, like that of the hiatus in global surface warming during the first decade of the 21st century, the tropical Pacific experienced a prolonged period of unusual heat gain because of the La Niña-like conditions that prevailed at this time. Much of that heat gain was transported to the Indian Ocean through the Indonesia Seas—the porous boundary that separates the Pacific from the Indian Oceans. Outside the tropics, sinking of water masses in the high latitudes of the North Atlantic can transport heat to abyssal depths on decadal and longer time scales as part of the Meridional Overturning Circulation. The Southern Ocean is also a key region for the uptake of anomalous heat associated with climate change.
Where the ocean exchanges heat with the atmosphere, and how the ocean stores and transports that heat, is really central to our understanding of how the climate system works across all time scales. To riff on the expression “follow the money”, if you want to understand how the climate system works, you have to “follow the heat” in the ocean.
In his 2014 post, Richard wrote about changes in ocean circulation across the Pacific that were likely responsible for increased deep ocean heat uptake (and slower surface warming) during the first decade or so of the 20th century. Since then, we’ve had another, shorter, period since 2016 where global surface temperatures have not increased noticeably. Are the same processes at work?
Richard: Warming has continued apace since 2014: the recent 2011-2020 decade was about 1.1 ˚C warmer than 1850-1900 early industrial period based on the recent IPCC report. But the warming doesn’t progress smoothly, it comes in fits and starts. For example, rapid warming [since around 2011] peaked with the 2015/16 El Nino event, and this level of warmth has been maintained since, rather than continuing to rise, with further ups and downs balancing out. Since 2014, energy has continued to accumulateand heat the oceans. Surface temperature is closely related to heating of the uppermost layer of ocean, so how much of the planetary heating goes into this upper layer or layers beneath affects the surface warming rate.
(top) Global average surface temperature each year since 1900 compared to the 20th-century average (the zero line). A slowdown in surface warming in the first decade of the 21st century was associated with frequent La Niña conditions. (bottom) Satellite and ocean observations of energy increasing in the oceans, atmosphere, and land (planetary heat uptake) show that more heat is entering than leaving the planet (an energy imbalance) due to increasing greenhouse gas levels. NOAA Climate.gov image, based on data from NOAA National Centers for Environmental Information (top) and NASA/CERES data from Norman Loeb (bottom). **
In a simple sense, more overturning circulation in the Pacific (what goes down must come up) can draw down warm water in one region and this is replaced with cooler sub-surface water in another region. More heat can be used up in warming this newly emerged cool water, and the upshot is that accumulating energy is effectively moved downward into the ocean, and not concentrated in the upper layer, temporarily suppressing the rate of surface warming.
What has been learned since 2014 is that global warming is progressing with an unexpected pattern: more warming in the west Pacific and less in the east Pacific than simulated on average by global climate models. Whether this is a temporary effect or a longer-term discrepancy remains to be seen, but ultimately the long-term warming due to greenhouse gas increases will dominate. (Footnote 3)
Mike: Climate change skeptics latched onto the hiatus in global surface warming in the first decade of this century to argue that the science was flawed and that we didn’t need to be concerned after all. We’ve learned a lot more since then about how natural variability, and in particular ENSO, affects the global energy balance and its signature in global mean surface temperatures. As a result, this most recent slowdown has stirred up much less controversy, which is a real measure of progress in effectively communicating scientific advances.
Shang-Ping: Following the major El Niño of 2015-16, the global surface temperature increase has slowed. Over the past summer, the anomalous cooling of the equatorial Pacific intensified and the current La Niña formally entered the third year (Emily Becker post), the first such long-haul event in the 21st century. The ongoing La Niña may prevent global average temperature from breaking the record in 2023, but greenhouse gas-induced global warming grows steadily in magnitude. In fact, it most likely helped 2020, a year of La Niña, to tie the all-time high of 2016, a year following a major El Niño.
*Correction (11/1/22). This question previously stated that “Earth’s energy imbalance continues to grow…” but energy imbalance usually refers to the rate of energy accumulation (which may remain constant), not the cumulative excess energy, which continues to grow.
**Correction (11/1/22). The annotation in the shaded area of the bottom graph previously said “Earth’s energy imbalance continued to grow,” but energy imbalanceusually refers to the rate of energy accumulation (which may remain constant), not the cumulative excess energy, which continues to grow.
Footnotes
- Rebecca: Although the comparison is simplistic, we can also see that La Niña is no match for global warming simply by the relative sizes of their effects. Global warming due to human-produced greenhouse gases has raised Earth’s average surface temperature by around 1 degree Celsius (~2 degrees Fahrenheit) over the past 140 years. Even a strong La Niña only cools global average surface temperature by a tenth of a degree Celsius or so (a couple tenths of a degree Fahrenheit).
- Shang-Ping: Outside the tropics, La Niña excites an atmospheric wave train that propagates along a great circle path from Hawaii to Florida, weakening the Aleutian low-pressure center on the way. Anomalous north-to-south winds bring colder air that causes surface air temperature to decrease over northwestern North America while the Gulf of Alaska is anomalously cold as a result of the strengthened prevailing winds. In the Russian far east, positive temperature anomalies develop due to the weakened outbreaks of polar air.
- Richard: A leading explanation for how this “pattern effect” becomes established is that the uneven warming across the tropical Pacific is being reinforced by changes in low-altitude clouds. More warming in the west Pacific than the east Pacific increases atmospheric stability in the east, which favors more subtropical, low-altitude stratocumulus clouds. These clouds are effective at reflecting sunlight back to space, adding to (or amplifying) ocean cooling there.However, the opposite occurred during the strong 2015/16 El Niño, with strong warming in the subtropical east Pacific that broke up the stratocumulus cloud and allowed more sunlight to warm the ocean even more (e.g. https://doi.org/10.1029/2019GL086705). Only time will tell whether this reversal was temporary or spells the end of this uneven warming pattern.
This post first appeared on the NOAA ENSO blog and was written by Richard Allan, Michael Mcphaden, and Shang-Ping Xie.