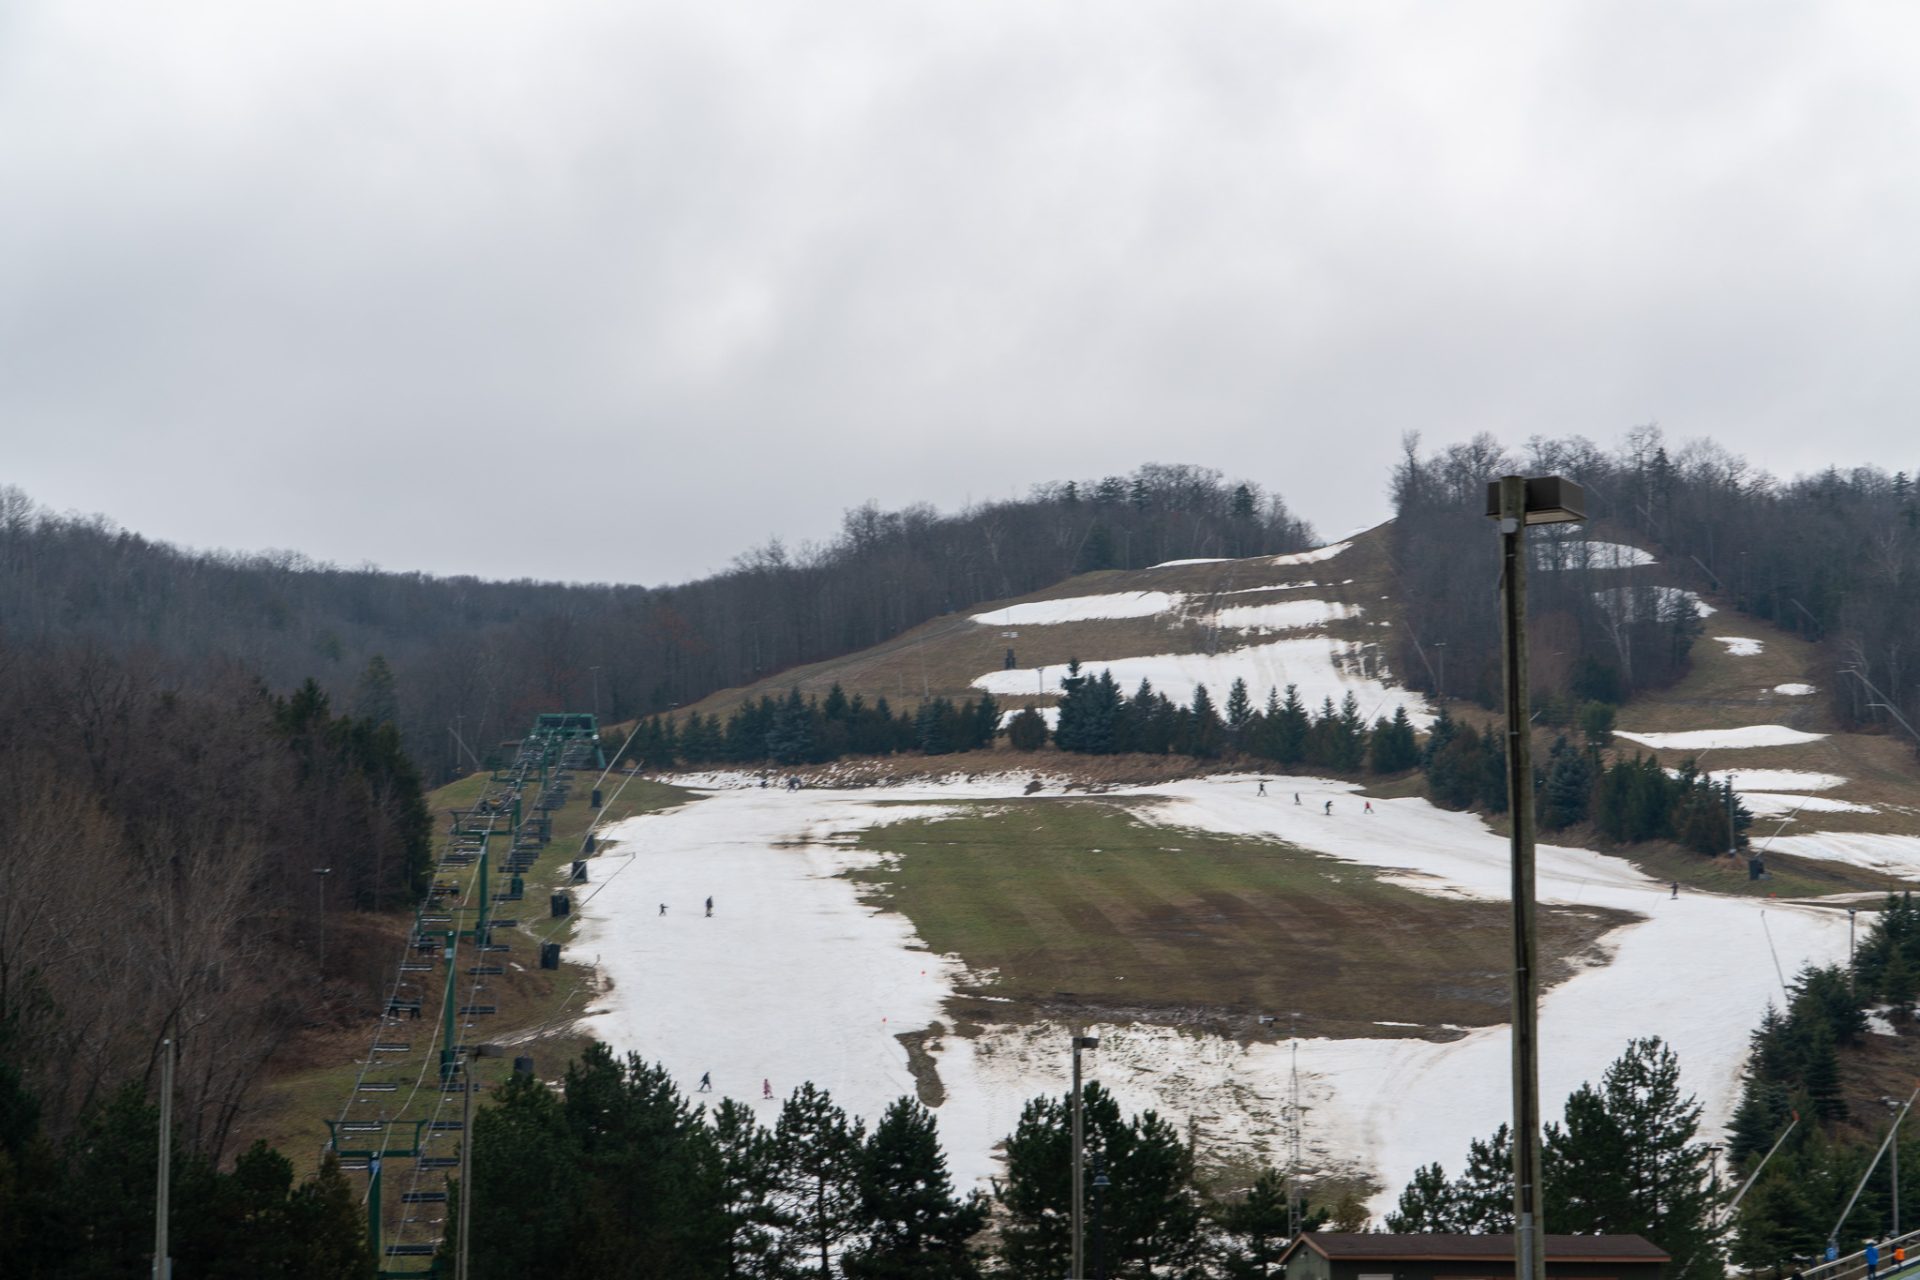
This winter has brought a slow start to the ski season for ski resorts across North America. With few storms delivering a mix of rain and snow, many ski areas are struggling to open terrain. On top of little base snow, many resorts have also suffered from warm temperatures, precluding the use of snow-making systems to make up for the lack of precipitation. Ocean surface temperatures in the Pacific have been much warmer than last year, indicating strong El Niño conditions, which are typically associated with diminished snowfall.
The Natural Resources Conservation Service (‘NRCS’), part of the U.S. Department of Agriculture, uses a network of more than 900 automated Snow Telemetry (‘snotel’) sites throughout the western United States to monitor snowfall, temperature, and other environmental variables year-round. Ski resorts do plenty of their own measuring, monitoring, and hyping up of the snowpack, but since ski resorts are not evenly distributed throughout the mountain ranges of the western U.S., the snotel network provides valuable information about the state of the snowpack across the region.
The NRCS recently compiled data for the western U.S. showing how our current snowpack stacks up against previous years. A colormap is shown below, with warmer colors showing less snow water equivalent (‘SWE’). Snow can have a wide range of densities, so rather than simply measuring the height of the snowpack, each snotel site records the amount of water in the snowpack.
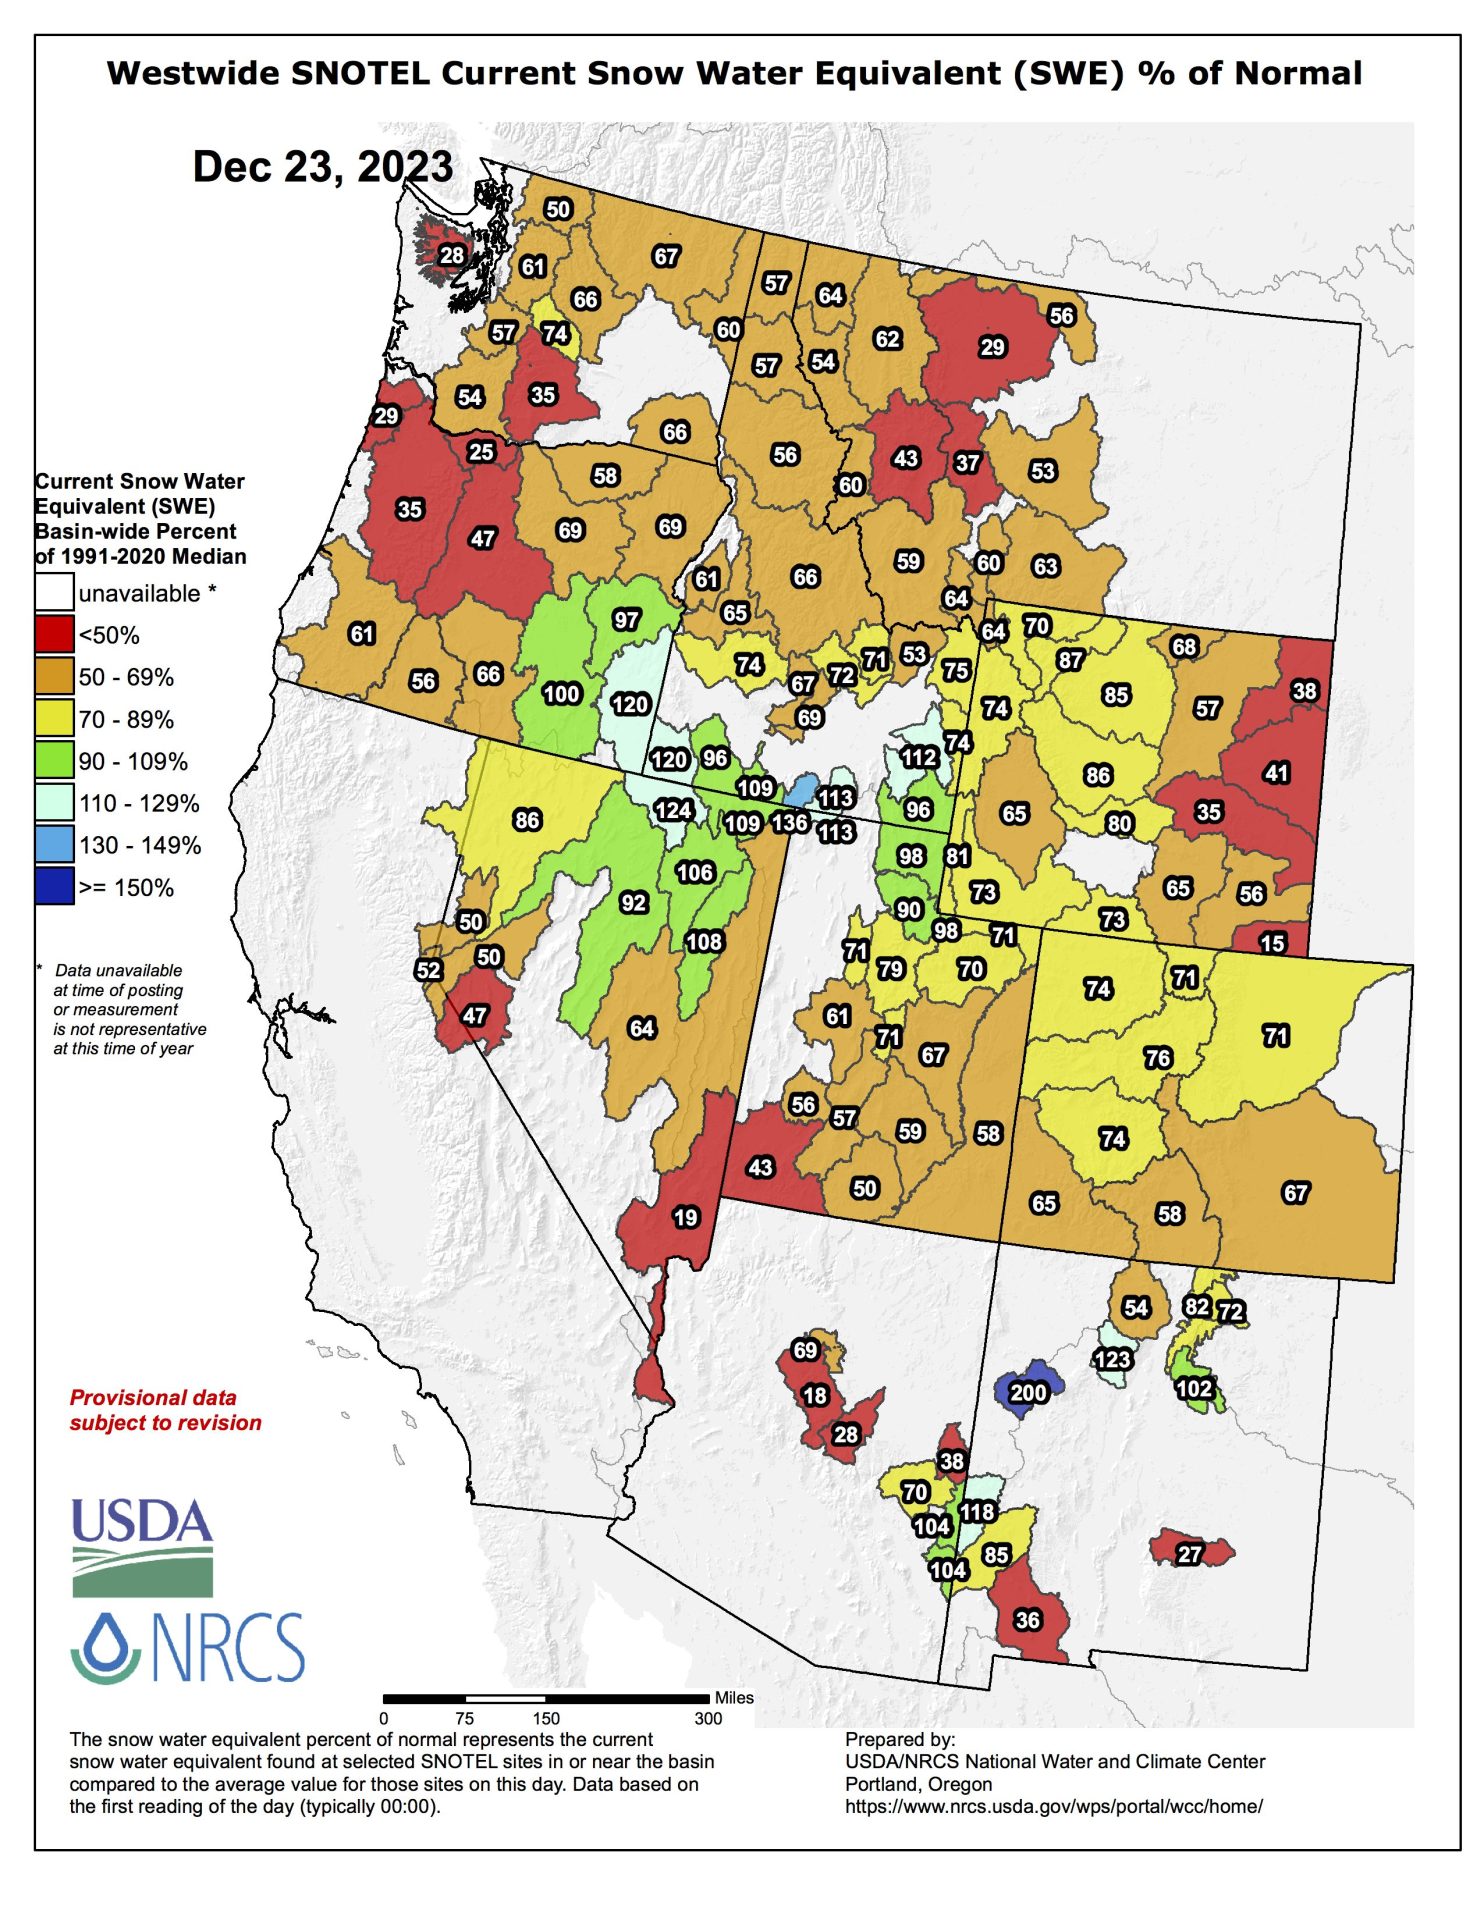
Starting in the Pacific Northwest, we see that much of the southern part of the cascades are well below 50% of normal, and the Olympics in Washington come in at just 28% of normal.
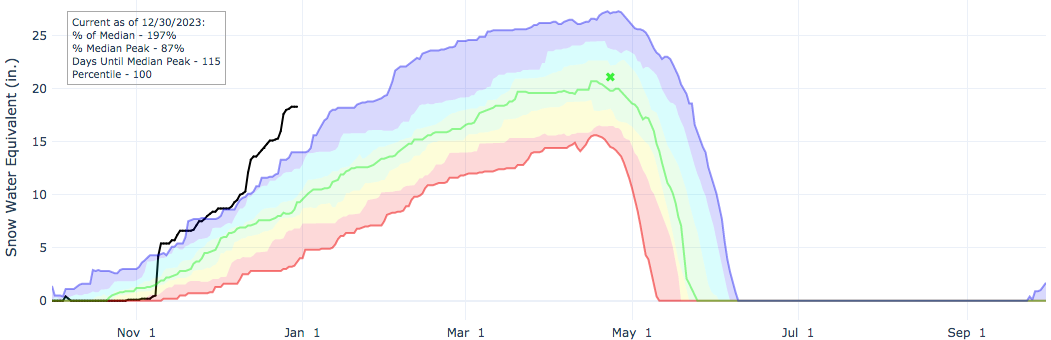
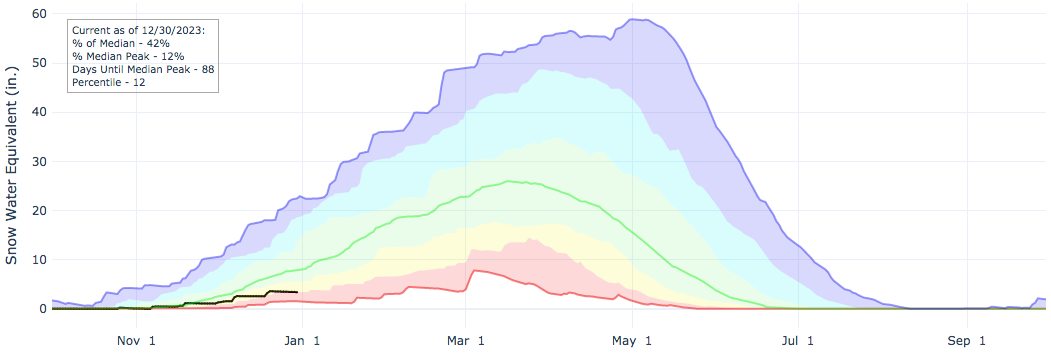
The above plot shows SWE data from several sites around Mt. Hood for this year (black line) compared to the average of all the winters from 1991-2020 (green line), along with the best (blue line) and worst (red line) seasons from this range. This year, the snowpack is fighting to separate itself from the worst season of the last thirty years. Unfortunately, this story will be mirrored in data from many other parts of the western U.S.
Moving south to California and the Sierra Nevadas, the story is a little bit better, with averages across the range slightly above 50%.
Looking at a similar plot for the Truckee area comparing this season to previous years, we see a little bit more differentiation between the black line and the red line. You might notice much more abrupt steps in this year’s line compared to the average line. Each of these steps comes from an individual storm, whereas the average line smooths out snowfall from storms arriving on many different dates. Notice that in mid-December the black line almost caught the average green line, and it looks like one more storm might have done it. Many ski areas will probably tell you that all they need is one more good storm to get all of their usual terrain open.
Moving east to Utah, specifically Little Cottonwood Canyon, we are afforded some good news in that this season is within a few percent of the average. In fact, because of some rather large storms in early December, Little Cottonwood Canyon was the proud owner of an above-average snowpack for a couple of weeks.
As we continue east to Colorado, the state of the snowpack deteriorates a little bit. Below is another SWE plot for Summit County, with the current snowpack at 73% of normal.
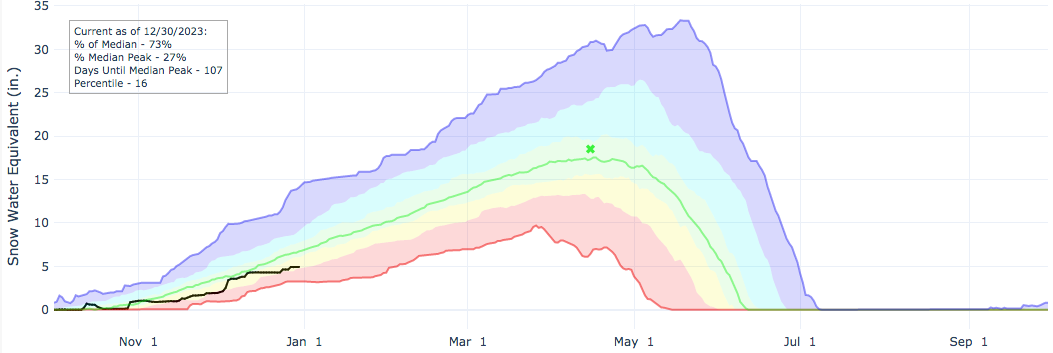
As Colorado is a continental snowpack, as opposed to the maritime snowpack of the Cascades and Sierras, less overall SWE is expected. The historical maximum SWE for Summit County is less than half that of Mt. Hood. However, Summit County resorts like Arapahoe Basin have similar base depths to Timberline Lodge and Mt. Hood Meadows, at around two feet.
- Related: Snowpack Climates, Explained
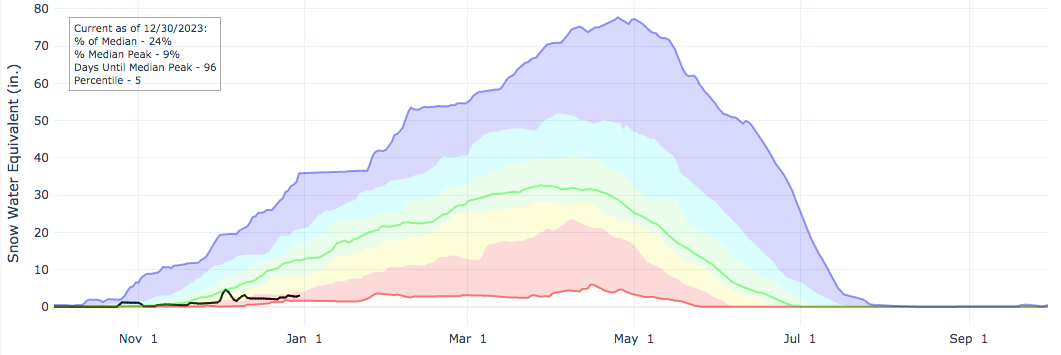
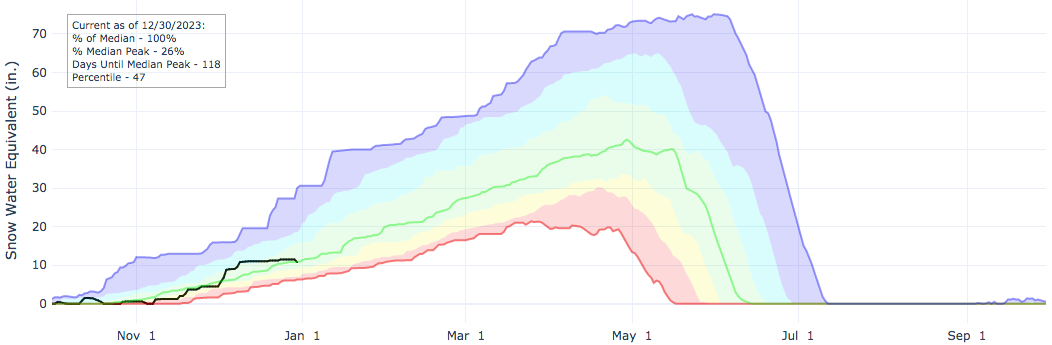
If you are wondering if anybody in North America has snow, the answer is that it is all up in Alaska. The plot below for the Chugach range shows they are at close to 200% of normal and are nearing 90% of the median peak several months early. This year may be the year for a trip to Alaska!
Much of the western U.S. could see a change in the weather some time after the new year. For now, let’s hope that January and February bring deeper totals than December did.