In a new study published in the Journal of Hydrometeorology, researchers analyzed snow cover data gathered from weekly satellite flyovers from 1967 to 2021. The study was divided into sections of the northern hemisphere for analysis. Of the grids that researchers determined had reliable data, they found that snow cover is declining in nearly twice as many grids as it is advancing.
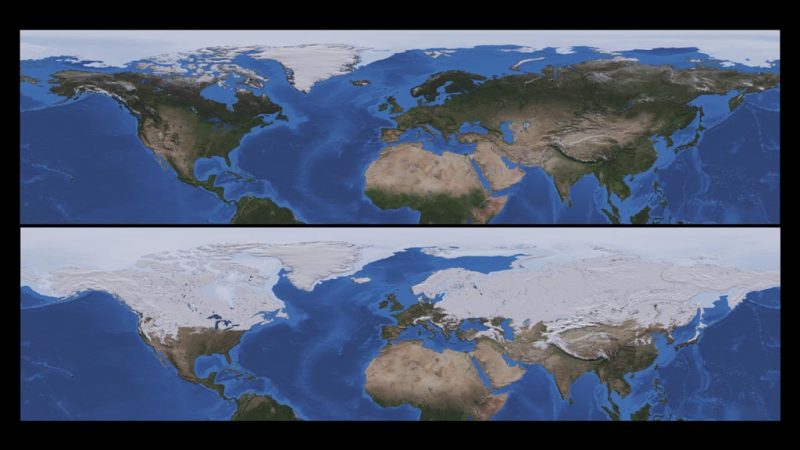
Understanding snow cover trends is important for more reasons than a having deep ski season, such as understanding the role that snow plays in the global energy balance. Snow’s high ability to reflect light (80-90% of sunlight) and insulating characteristics affect surface temperatures on a regional scale and thermostability on a continent-wide scale. On average, snow covers 40% of the planet’s land surface, and it is critical for the survival of many habitats.
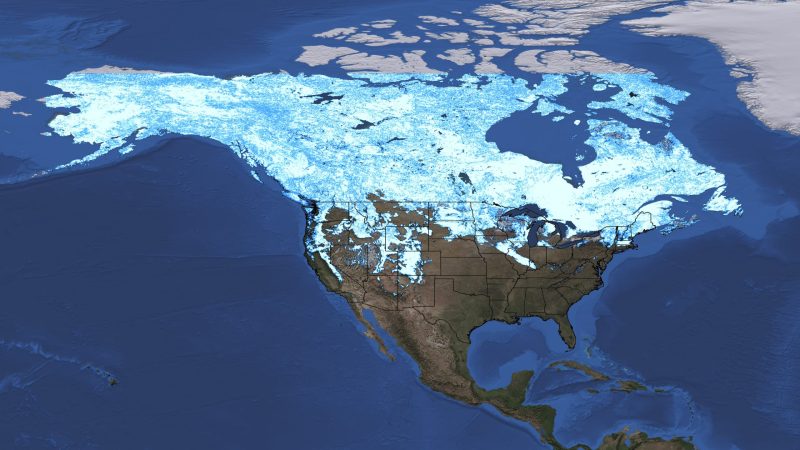
The data shows that the snow cover is receding more often than not in the Arctic region, as well as the southern latitudes of the northern hemisphere. However, some areas such as Eastern Canada are seeing an increase in snow cover. Researchers believe this could be due to the increasing temperatures in the areas that are typically very cold but still below freezing, allowing the atmosphere to hold more water, which then falls as snow.
Robert Lund, professor and department chair of statistics at the UC Santa Cruz Baskin School of Engineering, was at the head of this study. Lund believes this study to be the first dependable analysis of snow cover trends in the northern hemisphere because of the rigor of the statistical methods. The satellite data came back in a sequence of 0’s and 1’s to indicate if snow was present. Lund admits the study took so long to complete because of the poor satellite data, and sifting through to find reliable data was a major challenge.
This study will continue to serve as a resource for the scientific community who also may want to evaluate this snow cover data for their research. Lund worked closely with UCSC Ph.D candidate Jiajie Kong Assistant Professor of Math and Statistics at the University of North Florida Yisu Jia, Professor of Meteorology and Climatology at Mississippi State University Jamie Dyer, Associate Professor of Statistics at Mississippi State University Jonathan Woody, and Professor of Statistics and Operations Research at the University of North Carolina at Chapel Hill J. S. Marron. This research was supported by funding from the National Science Foundation.
If you found this article interesting, check out NASA’s Earth Observatory. On this NASA site, you can check out a variety of global maps that show snow cover, vegetation levels, and even chlorophyll levels.