On a brisk early February morning, all of us El Niño-Southern Oscillation (ENSO) forecasters emerged from our burrows and saw our shadows. That can mean only one thing: conditions are favorable for the development of La Niña within the next six months. Yes, the February ENSO Outlook officially announces that we are in a La Niña Watch, even while, at the current moment, the Pacific Ocean remains in an El Niño (this is simultaneous to the ongoing El Niño Advisory—here is an explainer to help sort it out). The outlook gives a 79% chance that El Niño will transition to ENSO-Neutral by the April–June period and then a 55% chance the Pacific will transition into La Niña in June–August. Confused? I’ll explain it all without the help of any prognosticating rodents (take THAT, Punxsutawney Phil).
El Niño’s current status
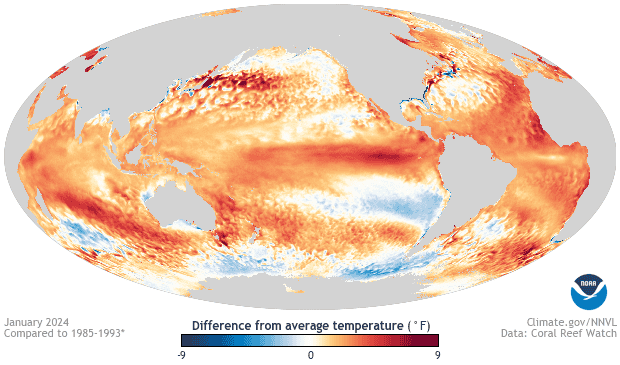
Let’s start with the here and now. At the current moment, El Niño remains across the equatorial Pacific Ocean. In January, sea surface temperatures remained above average across most of the Pacific, though temperatures fell a bit across the eastern and central Pacific. Monthly values in the Niño-3.4 region (the key tropical Pacific monitoring region for ENSO and the basis for the Oceanic Niño Index (see below) dropped from just over 2°C above average in December 2023 to 1.87°C above average in January 2024. Overall, the most recent Oceanic Niño Index (ONI) value—how NOAA classifies the strength of events—for November–January places this event’s peak strength at ~2°C, or the fifth highest on records back to 1950 (**).
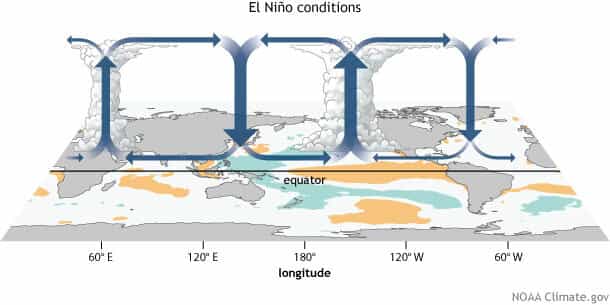
Atmospherically, El Niño weakened a bit as well over the last month. Remember, El Niño is an ocean-atmospheric phenomenon. During El Niño, the atmosphere over the tropics—the Walker Circulation—gets all jumbled up. The result in the Pacific is weakened trade winds, an increase in thunderstorm activity near the Dateline, and a reduction in thunderstorms across the Western Pacific (also,usually, across the Amazon). However, in January, the trade winds were closer to average across the equatorial Pacific, and while thunderstorm activity remained a bit elevated near the Dateline, it was instead closer to average across Indonesia in the western Pacific.
Put together, it looks clear that this El Niño event is past its peak. However, it’s important to remember that El Niño’s impacts on global temperature and precipitation can linger through April.
Is that all?
While everything I said above is all fine for the surface, the BIG story is happening underneath the sea surface in the Pacific. Averaged across the entire equatorial Pacific Ocean, ocean temperatures in the upper 300 meters returned to near-average for the first time in almost a year. And it’s clear that cooler-than-average ocean waters are widespread at depth and expanding eastward, even while above-average temperatures persist closer to the surface in the central/eastern Pacific.
Where is this all going?
That’s the million-dollar question. The seasonal prediction models that forecasters look to for guidance are pretty confident in a transition from El Niño to ENSO-neutral sometime during the northern hemisphere spring 2024. Following that, there is a general consensus among the models that La Niña will follow during the summer. When it comes to transitions, there is always a bit of uncertainty on the exact timing, as an El Niño can end in a hurry. After all, the current outlook has only a two-season difference between the end of El Niño (79% chance in April-June), and the start of La Niña (55% chance in June-August). Some of the influencers of that transition can be atmospheric patterns that are not forecastable this early on, like the Madden-Julian Oscillation or random weather events.
How common are transitions from El Niño to La Niña?
Going back to 1950, over half of the El Niño events were followed shortly thereafter by a transition to La Niña (after a brief period of time in ENSO-Neutral). So, it would not be at all uncommon to see this sort of potential outcome this year.
Breaking that down even more by looking at similar strong El Niños, five of the eight events since 1950 were followed by a La Niña. And that transition happened rapidly. Two years (1973 and 1998) had only one 3-month period of ENSO-Neutral conditions before switching to La Niña. Two years (1983, 2010) had two 3-month periods of ENSO-Neutral in between. And 2015 had three 3-month periods.
Suffice to say, the historical record suggests that if the equatorial Pacific moves from a strong El Niño into a La Niña, it doesn’t seem to waste its time.
We’ll keep our eyes on the Pacific for you to help narrow down when and how this El Niño will end. So check back with us next month!
Signed,
The most accurate mammalian weather/climate forecasters
** A pesky annoyance is the fact the 1965-66 El Niño also peaked at 2.0°C, but it did so only during the September-November and October-December seasons. By November 1965-January 1966, it was 1.7°C. So, if we rank just by November-January seasons, the current 2023-24 event is ranked fifth. But if we rank by all near-winter seasons, then this event is basically tied for fifth.
This post first appeared on the climate.gov ENSO Blog.