This post first appeared on the climate.gov ENSO blog and was written by Nat Johnson
ENSO-neutral conditions continue in the tropics, but ENSO’s next performance may be approaching, as forecasters have increased the likelihood (~70% probability) that La Niña will reemerge by early winter. A La Niña Watch remains in effect.
Wind of change
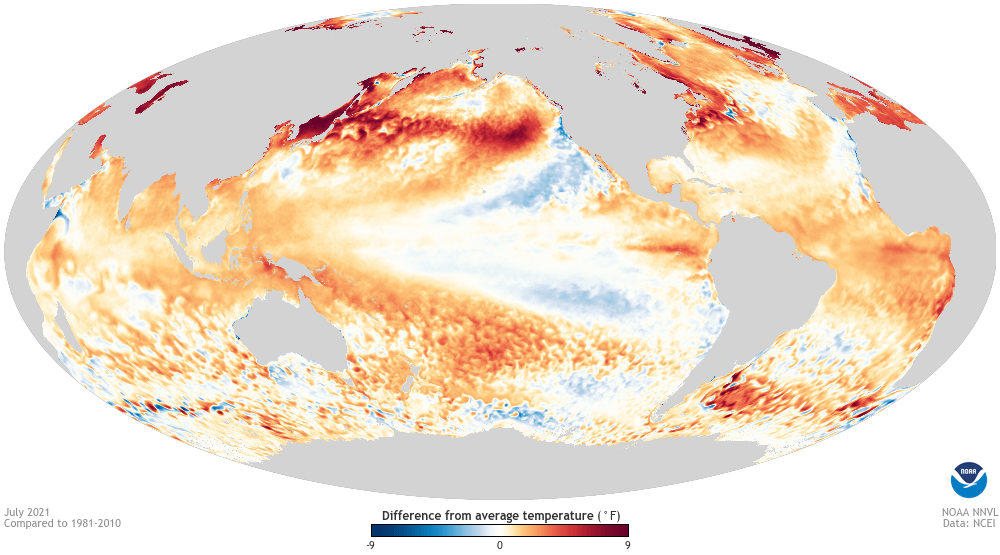
If you just took a very quick look at the tropical Pacific surface, you might think things haven’t changed much since last month. The July sea surface temperature in the Niño 3.4 region, the main region we use to monitor ENSO (ENSO = El Niño-Southern Oscillation, the whole El Niño, and La Niña system), was 0.33°C below the 1991–2020 average. This departure from average is firmly within ENSO-neutral territory and is similar to the departure that Tom described last month.
But regular readers of the blog know that we also need to scratch beneath (and above) the surface with ENSO. When we do, we see that there have been some major changes in July. First, looking below, we see that the subsurface tropical Pacific Ocean temperatures took a sharp downward turn over the past month, breaking the string of several months of above-average tropical Pacific Ocean temperatures. If these below-average subsurface temperatures persist, then they may provide a source of cool water for the onset of the next La Niña.
Next, we look up at the atmospheric arm of ENSO, the anomalous Walker circulation, which also may be giving us some hints that La Niña is itching for a return. La Niña brings a stronger-than-average Walker circulation, meaning stronger-than-average east-to-west trade winds, higher-than-average pressure in the eastern Pacific, and lower-than-average pressure in the western Pacific. We have two indexes that measure this pressure relationship, the Southern Oscillation Index and the Equatorial Southern Oscillation Index, which are based on different locations where the pressure is recorded. Both indexes show an upward jump in July, indicating that the Walker circulation strengthened. In fact, the July Southern Oscillation Index value was the highest since last February when La Niña conditions were present.
Tomorrow never knows
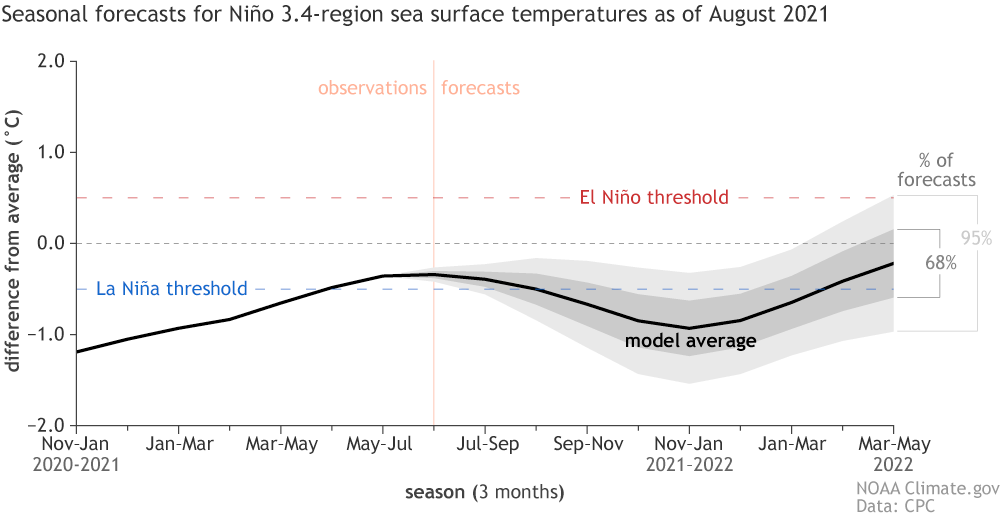
So, are these recent changes just a temporary blip or a sign of ENSO’s warm-up act? The latest forecast from the North American Multi-Model Ensemble (NMME) suggest they may be more than a blip, indicating a likelihood that the surface temperatures in the Niño 3.4 region are about to dip downward. Moreover, most model forecasts predict the onset of La Niña by fall. The forecast from the NOAA Climate Prediction Center is in good agreement with these computer models, forecasting a 60-70% probability of La Niña between fall and winter of 2021/22. The likelihood of El Niño is extremely low (less than 4%) during this period, so if La Niña doesn’t develop, then it’s a good bet that we would remain ENSO-neutral. If La Niña does redevelop, it would be the second winter in a row, which is a rather common occurrence.
Have you ever seen the rain?
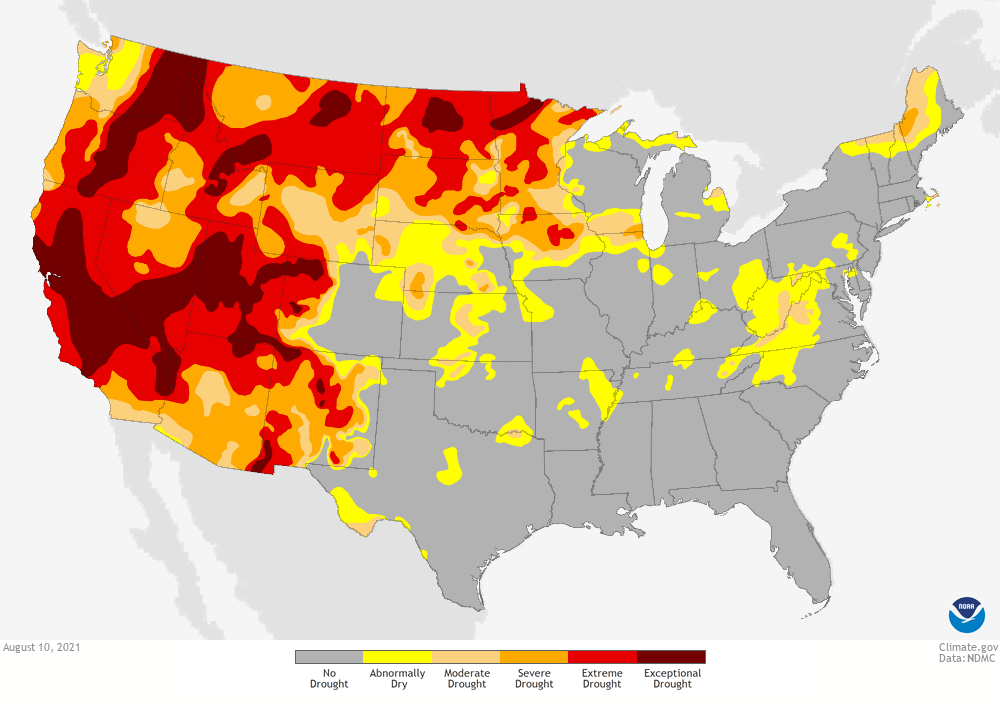
The possible return of La Niña is an understandable concern for our friends in the western US, who have endured terrible drought and the accompanying extreme heat and devastating wildfires. The focus of concern from an ENSO perspective is the Southwest, given that La Niña is linked to reduced rain and mountain snowfall over the region from late fall through winter.
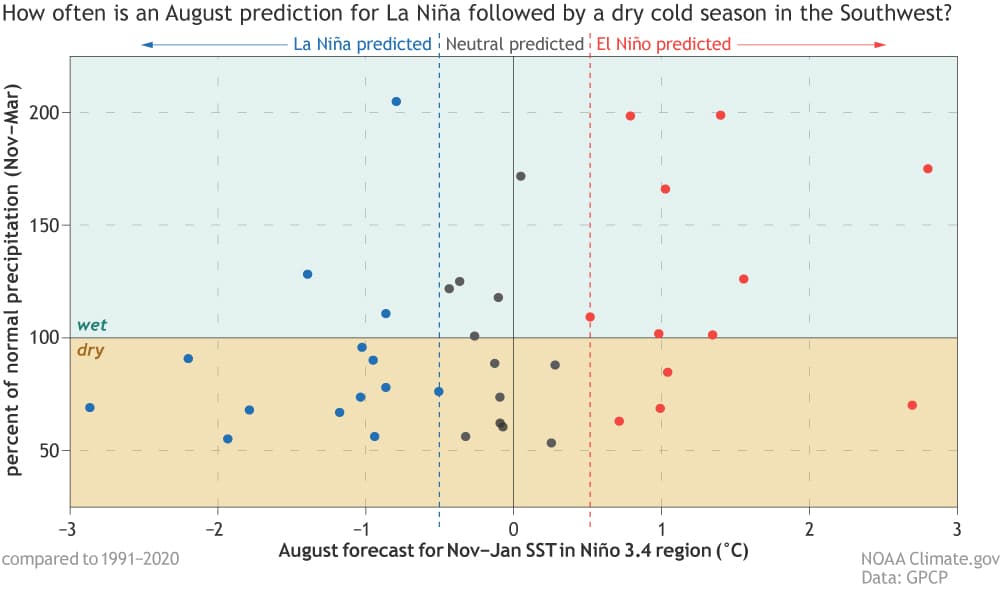
So, what does the current ENSO forecast mean for the ongoing drought over the southwestern US? To give some perspective, I went through the archive of all NMME August ENSO forecasts from 1982 – 2020 (1) and looked at the relationship between the forecast for ENSO in November – January (the typical peak season of El Niño and La Niña) and the actual November through March precipitation over the southwestern US. The scatter plot above shows this relationship for the precipitation averaged over the southwest region extending about as far north as San Francisco, California, and as far east as Amarillo, Texas (2).
The plot above reveals an unfortunate tendency that we may have suspected: most (11 of 14) August NMME forecasts that predicted a winter La Niña, like the current forecast, were tied to below-average precipitation in the southwestern US. However, there were a few La Niña-predicted winters near average and even a few above average, including the wettest winter during the period (3). Therefore, we can conclude that the current forecast suggests that substantial drought relief may not be likely for the Southwest this winter, but there is still a considerable amount of uncertainty at this time and no reason to give up hope!
Rock you like a hurricane
I would be remiss if I close without mentioning the potential impact of the ENSO forecast on the Atlantic hurricane season, given that we are about to enter the peak of the season. NOAA recently issued their update to the 2021 Atlantic Hurricane Season Outlook, forecasting a 65% likelihood for an above-average season, which is a slight increase in confidence since their May outlook. The development of La Niña in the latter portion of the hurricane season could help to boost the number of Atlantic tropical storms and hurricanes, so we have another reason to closely watch what happens in the Pacific over the next few months.
Closing time
I know this is the second Emily-less ENSO update post in a row, and I also feel your pain! I’m finding her shoes to be quite roomy, but I have done my best to reach the end of this post without tripping. Don’t worry, Emily will be back at the end of the month to drop some knowledge about the North American Monsoon, so please check back in a couple of weeks. In the meantime, keep your attention to the tropics – the opening act for the next La Niña may be warming up.
Footnotes
- At this point, you might be saying, “Wait, Nat, you’re telling me that the NMME existed as far back as 1982?” The answer is certainly no, but each of the NMME model centers generated retrospective forecasts as far back as 1982 (the GFDL SPEAR model forecasts only extend back to 1991, but all others go back to 1982). These retrospective forecasts are produced the same way as the current actual forecasts even though we know the answers (the actual weather that occurred) that the models should produce. Long archives of retrospective forecasts are incredibly useful for diagnosing and correcting for systematic errors in the forecasts and for providing estimates of how skillful forecast models are expected to be.
- To be more precise, I calculated the average precipitation anomaly in all land regions between 30°N and 38°N and between 102°W and 125°W. This region extends far enough north to capture the expected La Niña dry signal and far enough east to capture the region currently experiencing drought.
- This happened to be the winter of 1992/93. The NMME predicted a La Niña that did not materialize (that winter was ENSO-neutral), so this a reminder that an upcoming La Niña certainly is not set in stone!
The article as write is a bunch of gobbledygook. Makes no sense. Could you please write something simplified.
Love you, brother, but please be wrong again, and as wrong as 1992-93