This post first appeared on the climate.gov ENSO blog and was written by Emily Becker
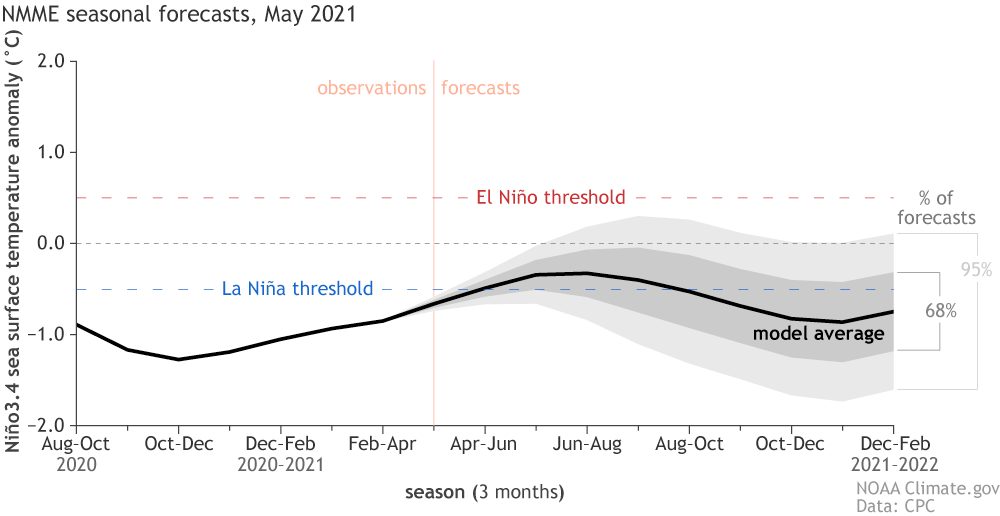
La Niña conditions have ended and NOAA forecasters estimate about a 67% chance that neutral conditions will continue through the summer. The ENSO forecast for the fall is less confident, with odds of a second-year La Niña currently hovering around 50–55%.
Spring cleaning
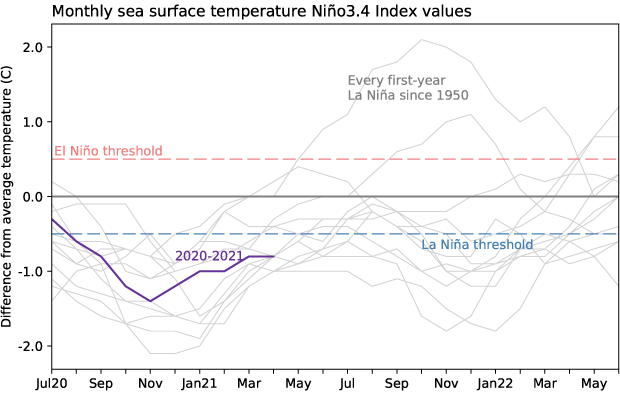
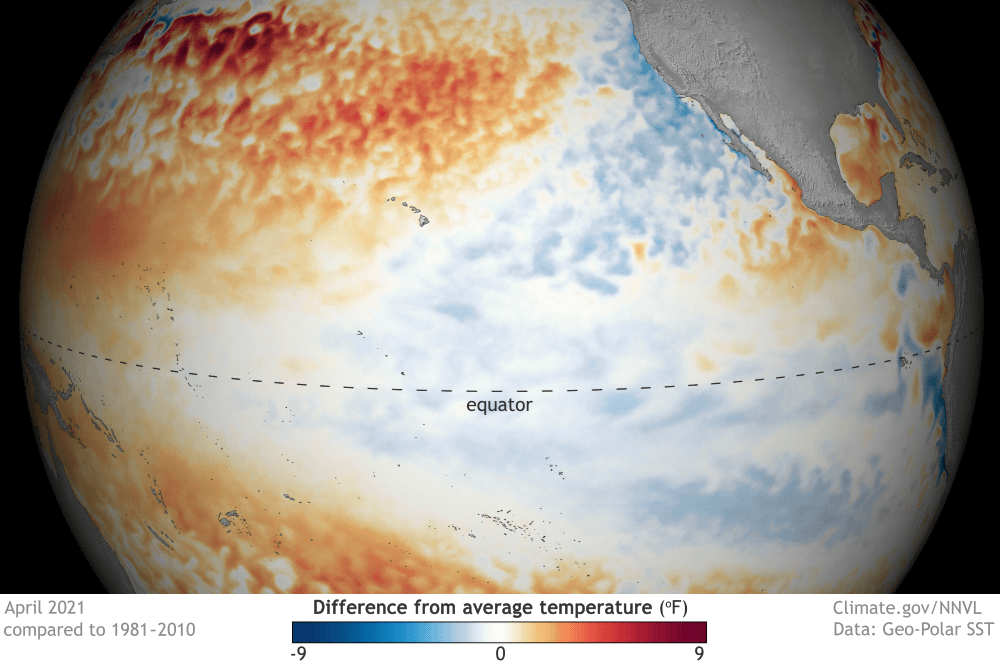
If you’ve been paying very close attention to the surface temperature of the tropical Pacific Ocean (and really, who doesn’t?!) you may have noticed that the April 2021 Niño 3.4 Index, at 0.75°C below average, still exceeds the La Niña threshold of 0.5°C below average. This is according to ERSSTv5, our primary sea surface temperature dataset.
By the way, “average” is now calculated over 1991–2020. Check out the second half of this post for more on what that means for measuring ENSO, and this climate.gov post by our esteemed editor for what it means as far as US climate.
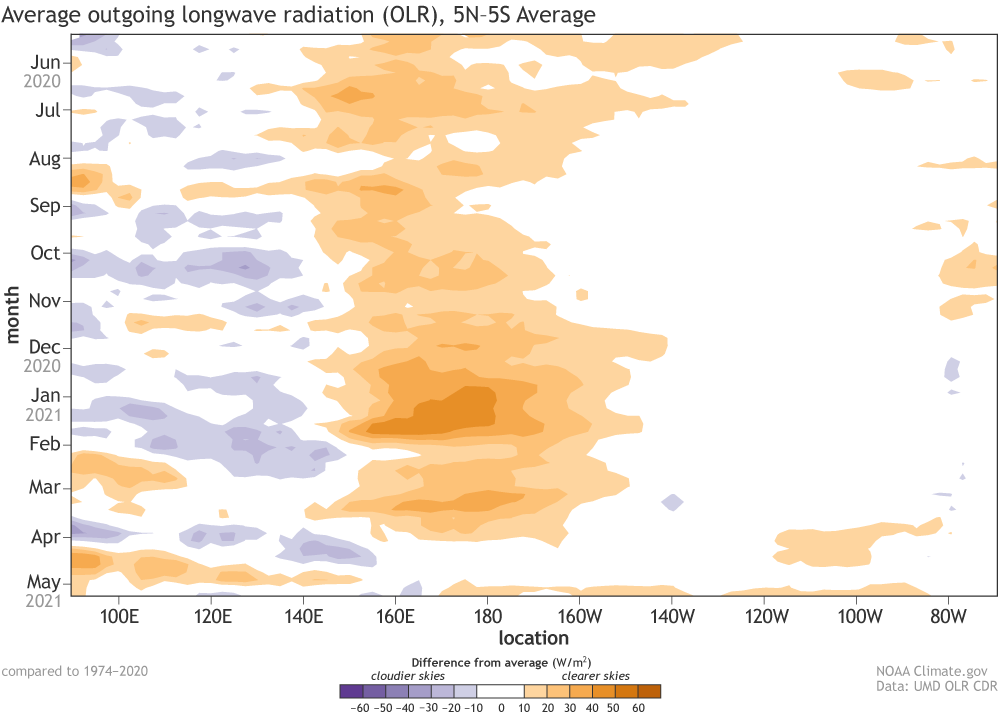
However, as we know from long experience, ENSO (El Niño/Southern Oscillation) is more than just the ocean surface temperature anomaly (the difference from the long-term mean). The atmospheric component is just as important, as it serves to reinforce the surface temperature anomaly and transmit ENSO’s impacts across the globe. Over the past few weeks, atmospheric conditions over the tropical Pacific no longer resemble the strengthened Walker circulation pattern that we expect during La Niña.
That strengthened Walker circulation is characterized by reduced rain and clouds over the central Pacific and more over the far western Pacific and Indonesia. This pattern was evident for the past several months, especially the drier-than-average region over the central tropical Pacific, but has dissipated as of early April.
Other signifiers, such as stronger-than-average trade winds, have also diminished across most of the Pacific Ocean in the past month. The Southern Oscillation Index and Equatorial Southern Oscillation Index, both of which measure the atmospheric component of ENSO (more details here), are also indicating neutral conditions. Hence, the ENSO forecast team has concluded that La Niña is over, despite the sea surface temperature anomaly.
A sea surface temperature anomaly of -0.5°C (or, in the case of El Niño, +0.5°C) isn’t a magic switch that causes an instant atmospheric reaction, as we’ve seen many times before. For example, a couple of months preceding the last El Niño featured sea surface temperature anomalies near or slightly exceeding the thresholds, but a coherent atmospheric response didn’t kick in right away. The atmosphere-ocean system is vastly complicated, of course, and there are always many different things going on at once, so a delayed response isn’t surprising. As an atmospheric scientist, I’d actually be very surprised if the atmosphere coupling occurred immediately upon crossing the ENSO threshold!
Finally, the water below the surface of the tropical Pacific is warmer than average and a downwelling Kelvin wave is moving westward under the surface. This means that there are limited sources of cooler-than-average water to replenish the surface over the next few months, adding some confidence that La Niña is done… for now.
Springboard
What everyone would like to know, of course, is what will happen ENSO-wise later in the year, following the neutral conditions that are likely to remain through the summer. ENSO has a strong relationship with the Atlantic hurricane season (June–November), with El Niño tending to lead to a reduced number of tropical storms and hurricanes, and La Niña tending to enhance the season. Last year’s extremely active Atlantic hurricane season was influenced by La Niña, so of course, we’d like to get an idea of what’s ahead.
Let’s start with the easier case—chances that El Niño will develop are low, hovering around 8%. El Niño has developed following a first-year La Niña in the past, but we’ve only seen that happen twice since 1950, and most of the computer models give the development of El Niño similarly low odds.
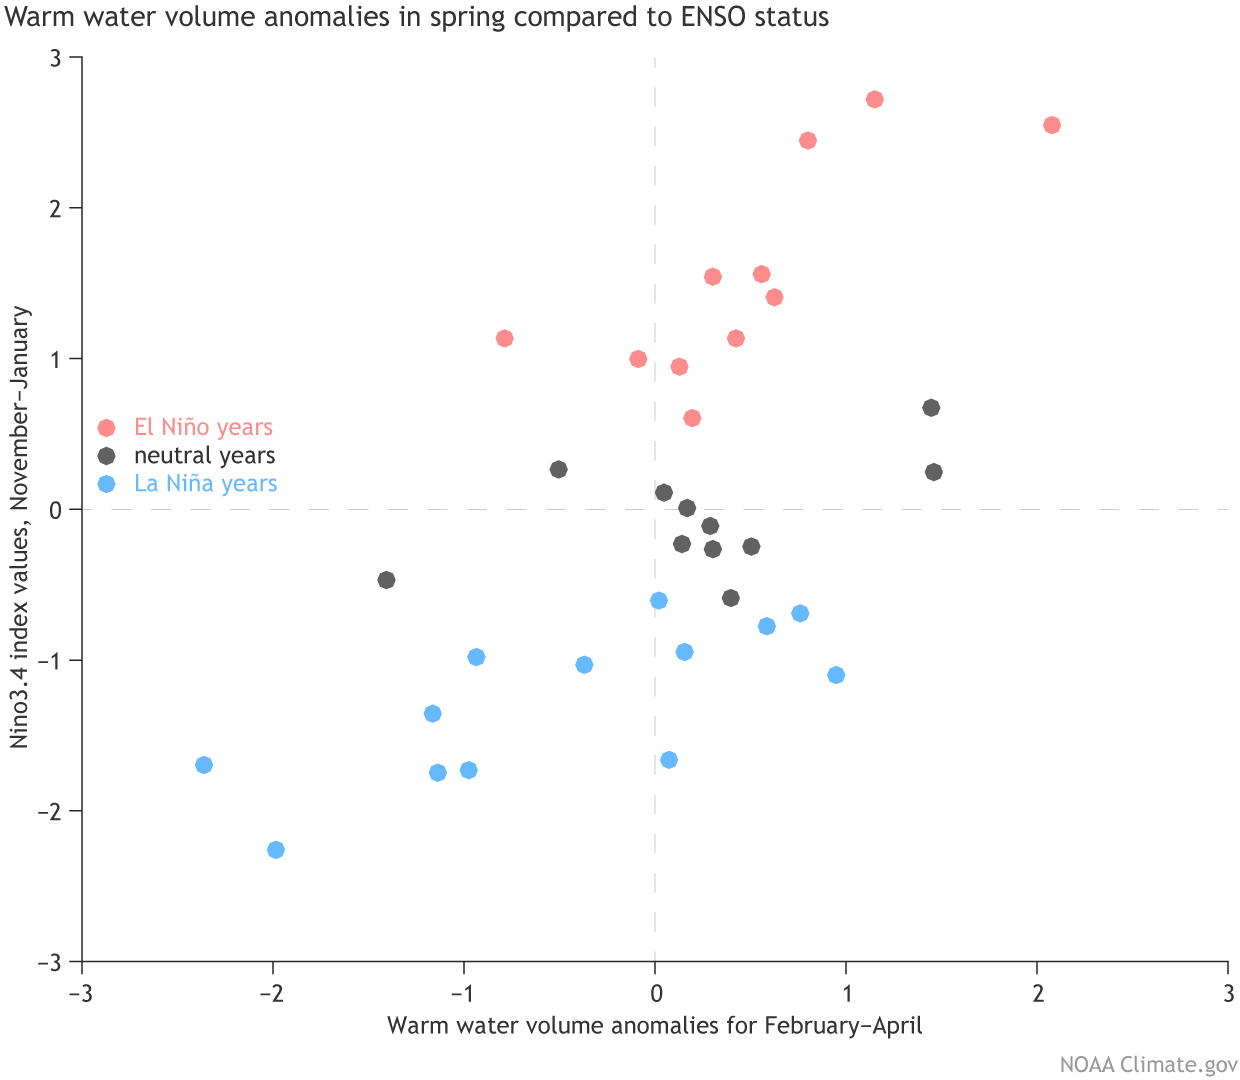
A substantial amount of warmer-than-average subsurface water in the spring can sometimes give an early heads-up that El Niño is on the way, but this April’s average of 0.6°C is not particularly high, ranking 12th out of the 43 years we have on record. The February–April 2021 average is just about zero. Other springs with a similar value have been followed by El Niño, La Niña, or neutral in the subsequent fall. Our guest blogger Aaron Levine discussed springtime ENSO prediction—head over there for more details. So, to sum up: small chance of El Niño.
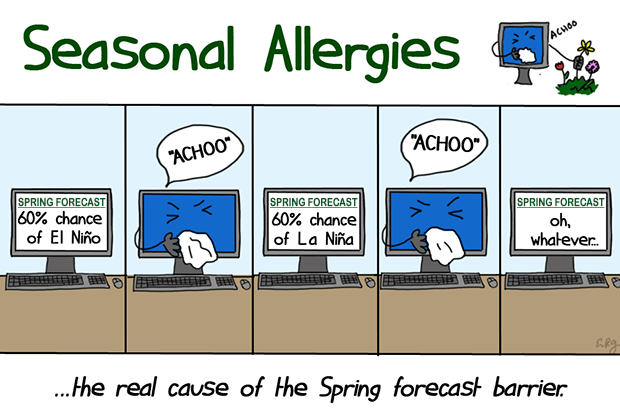
The likelihood of La Niña versus neutral after the summer is less clear. Many of the computer models are suggesting that we may see a second-year La Niña, a common occurrence in the historical record (and a topic that Nat will be covering in his post later this month). However, the spring predictability barrier—forecasts made in the spring tend to be less skillful than forecasts made in other times of the year—is still in effect for May predictions, reducing the confidence in forecasts for the fall and winter.
Currently, forecasters estimate the chance of La Niña during August-October, the heart of the hurricane season, at 42%, which is slightly lower than the 50% chance of neutral.
There are other factors at play in the hurricane season besides ENSO, including Atlantic Ocean temperatures. NOAA’s team is hard at work on the 2021 outlook, which will be released on May 20th.