
Each year from January to June, hundreds of scientists from around the world crunch the numbers on the previous year’s climate, reviewing and cataloging everything from sea level, to the number and strength of hurricanes in every part of the ocean, to the size of the Arctic sea ice pack. Led by scientists from NOAA’s National Centers for Environmental Information and published by the Bulletin of the American Meteorology Society, this year’s report offers insight on global climate indicators, extreme weather events, and other valuable information on the state of the climate.
2017 was one of three warmest years on record, the international report confirms
It’s official: 2017 was the third-warmest year on record for the globe, trailing 2016 and 2015, according to the 28th annual State of the Climate report. The planet also experienced record-high greenhouse gas concentrations as well as rises in sea level.
The annual checkup for the planet, led by scientists from NOAA’s National Centers for Environmental Information and published by the Bulletin of the American Meteorology Society, is based on contributions from more than 500 scientists in 65 countries and offers insight on global climate indicators, extreme weather events and other valuable environmental data.
Notable findings from the international report include:
- Levels of greenhouse gases were the highest on record. Major greenhouse gas concentrations in the atmosphere, including carbon dioxide (CO2), methane and nitrous oxide, reached new record highs. The 2017 average global CO2 concentration was 405.0 parts per million, the highest measured in the modern 38-year global record and in ice-core records dating back as far as 800,000 years.
- Sea level rise hit a new high, about 3.0 inches (7.7 cm) higher than the 1993 average. Global sea level is rising at an average rate of 1.2 inches (3.1 cm) per decade.
- Heat in the upper ocean hit a record high, reflecting the continued accumulation of thermal energy in the uppermost 2,300 feet of the global oceans.
- Global land and ocean combined surface temperature reached a near-record high. Depending on the dataset, average global surface temperatures were 0.68-0.86°F (0.38-0.48°C) above the 1981-2010 average. This marks 2017 as having the second, or third, warmest annual global temperature since records began in the mid to late 1800s.
- Sea surface temperatures hit a near-record high. While the global average sea surface temperature (SST) in 2017 was slightly below the 2016 value, the long-term trend remained upward.
- Drought dipped and then rebounded. The global area of drought fell sharply in early 2017 before rising to above-average values later in the year.
- Arctic maximum sea ice coverage fell to a record low. The 2017 maximum extent (coverage) of Arctic sea ice was the lowest in the 38-year record. The September 2017 sea-ice minimum was the eighth lowest on record, 25 percent smaller than the long-term average.
- The Antarctic also saw record-low sea ice coverage, which remained well below the 1981-2010 average. On March 1, 2017, the sea ice extent fell to 811,000 square miles (2.1 million square kilometers), the lowest observed daily value in the continuous satellite record that began in 1978.
- Unprecedented multiyear coral reef bleaching continued: A global coral bleaching event spanned from June 2014 through May 2017, resulting in unprecedented impacts on reefs. More than 95 percent of coral in some affected reef areas died.
- The total number of tropical cyclones were slightly above average overall. There were 85 named tropical cyclones in 2017, slightly above the 1981-2010 average of 82 storms.
- The State of the Climate in 2017 is the 28th edition in a peer-reviewed series published annually as a special supplement to the Bulletin of the American Meteorological Society. The journal makes the full report openly available online (118mb PDF).
Surface temperature in 2017
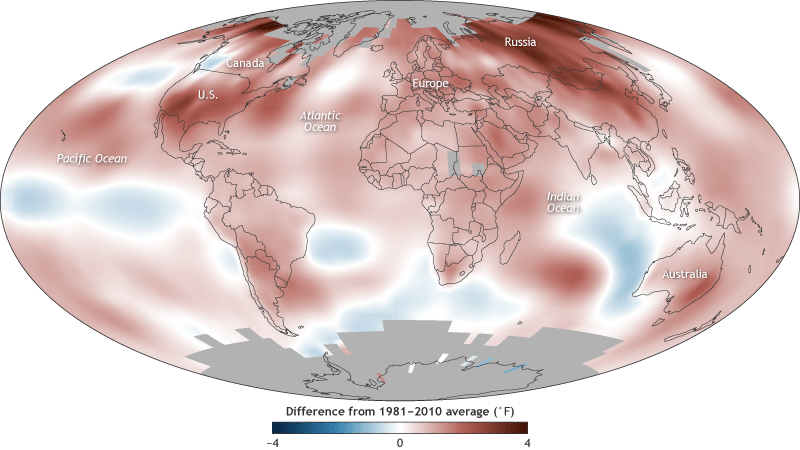
2017 was 0.38–0.48° Celsius (0.68–0.86° Fahrenheit) above the 1981–2010 average, with especially warm conditions in the high latitudes of North America and Russia. It was the warmest non-El Niño year in the instrumental record.
Surface temperature over time (1900-2017)
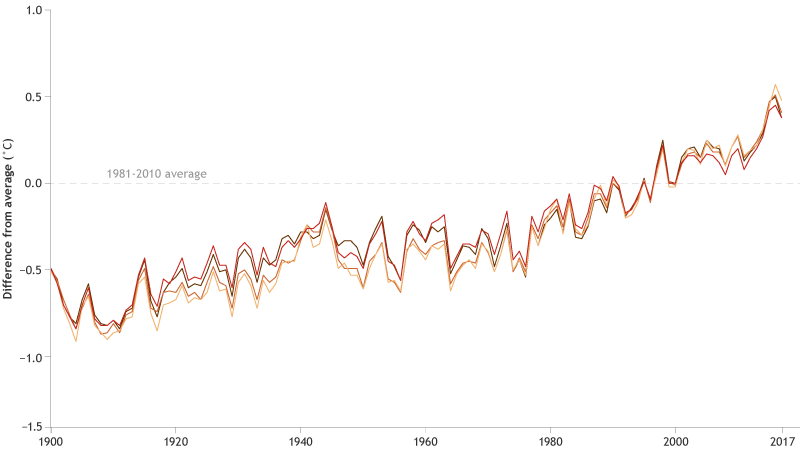
Since 1901, the planet’s surface has warmed by 0.7–0.9° Celsius (1.3–1.6° Fahrenheit) per century, but the rate of warming has nearly doubled since 1975 to 1.5–1.8° Celsius (2.7–3.2° Fahrenheit) per century. The 10 warmest years on record have all occurred since 1998, and the four warmest years on record have all occurred since 2014.
Mountain glaciers (1980–2017)
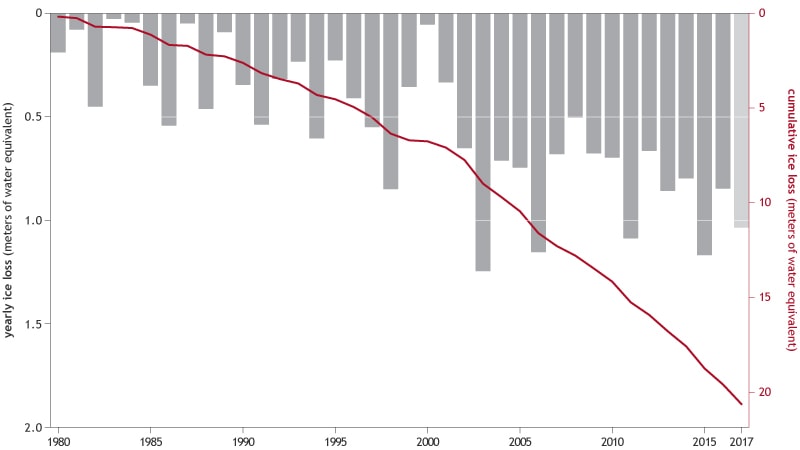
Based on the preliminary data, 2017, is likely to be the 38th year in a row of mass loss of mountain glaciers worldwide. According to the State of the Climate in 2017, “The cumulative mass balance loss from 1980 to 2016 is -19.9 meters, the equivalent of cutting a 22-meter-thick (72-foot-thick) slice off the top of the average glacier.”
Sea level in 2017
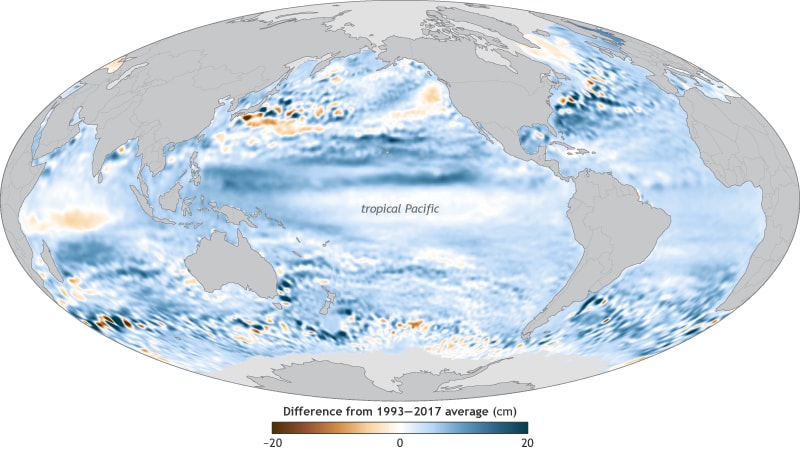
Global mean sea level in 2017 was the highest in the satellite record—77 millimeters (3 inches) higher than it was in 1993. Sea levels were higher than average over most of the globe, in keeping with the long-term upward trend. Sea levels were close to their long-term average in the central tropical Pacific, making the area a relative low spot.
Sea level over time (1993-2017)
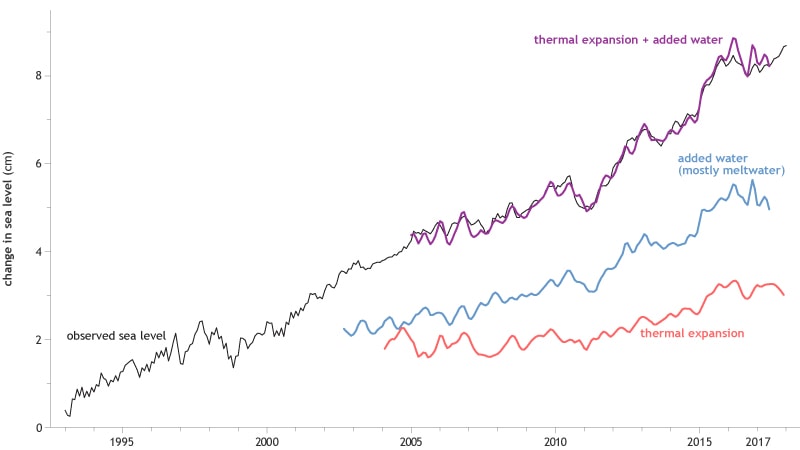
2017 set a new record for global sea level. The average rate of sea level rise since 1993 is 3.1 millimeters (0.12 inches) per year, and the increase has been accelerating by 0.084 millimeters (three thousands of an inch) per year each year. Sea level rise is increasing the severity and frequency of coastal flooding in many parts of the world.
Ocean heat in 2017
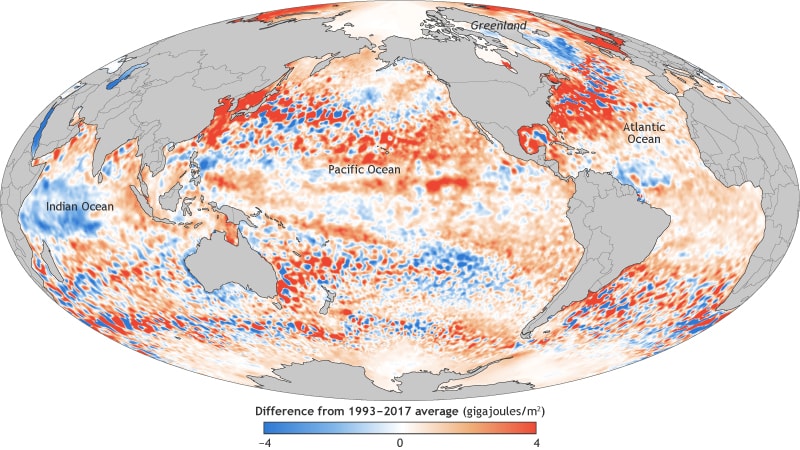
More than 90 percent of the excess heat absorbed by the climate system due to human-caused greenhouse gas warming is stored in the ocean.
Ocean heat over time (1993-2017)
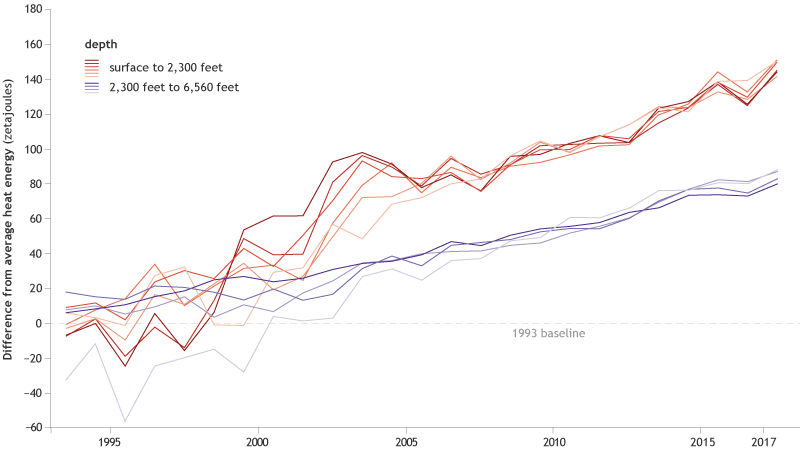
Human-produced greenhouse gases are slowing the rate at which heat escapes into space. Between 1993 and 2017, the global ocean has gained 0.36–0.40 watts of heat energy per square meter near the surface (0–700 meters) and 0.19–0.35 watts per square meter at deeper levels (700–2,000 meters).
Ocean uptake of human-produced carbon in 2017
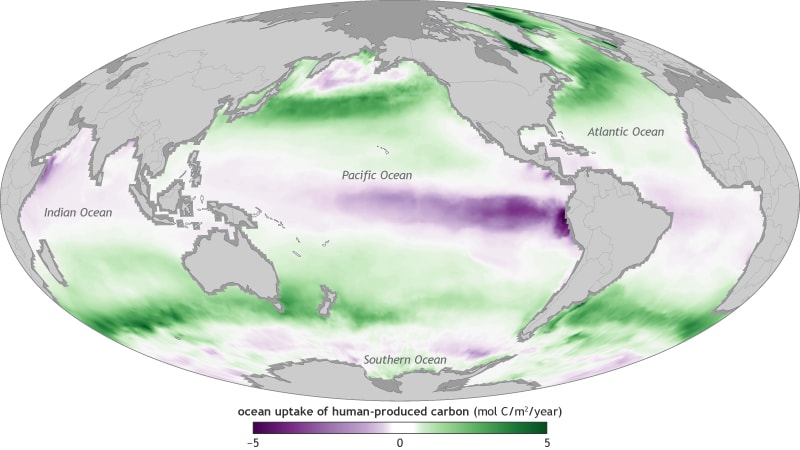
In 2017, the ocean absorbed 2.6 petagrams of human-produced carbon, which is 36% higher than the 2005-2015 average. By absorbing human-produced carbon dioxide, the ocean reduces the amount of warming those emissions would otherwise cause, but it increases the water’s acidity, which harms ocean life.
Ocean uptake of human-produced carbon (1982–2017)
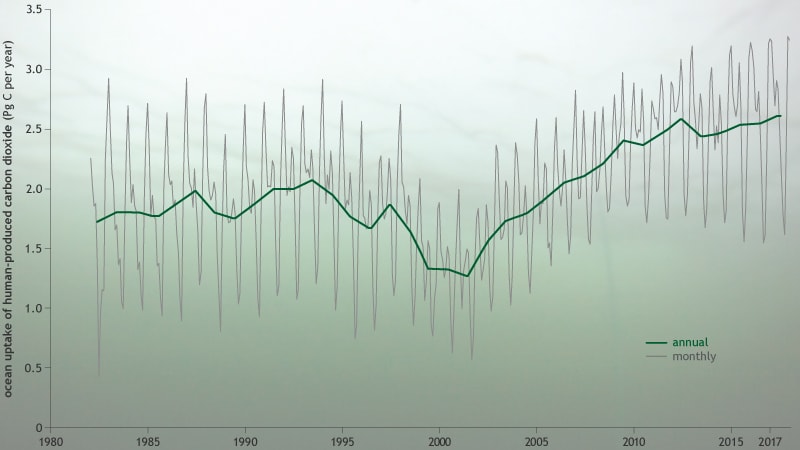
From 2002 through 2017, the ocean rapidly absorbed carbon dioxide from fossil fuel emissions. Since 2000, the rate of ocean uptake of human-produced carbon has increased by 0.8 billion tonnes per decade. If this trend continues, additional carbon dioxide will be kept out of the atmosphere—slowing atmospheric warming, but accelerating ocean acidification.
Carbon dioxide over time (1980-2017)
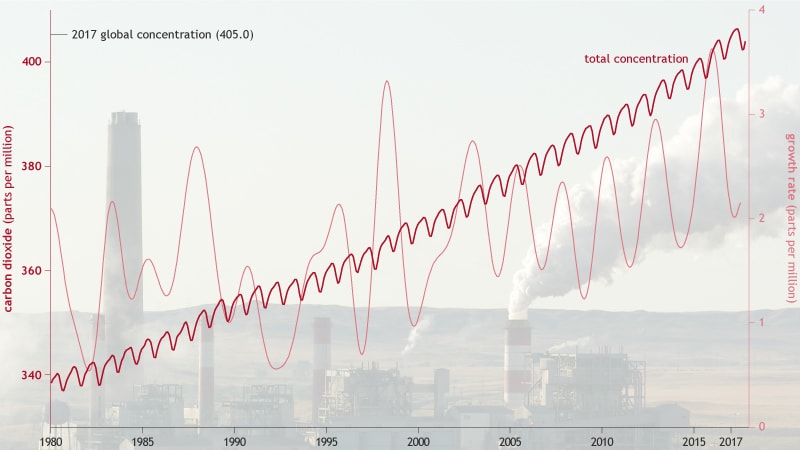
Since the start of the Industrial Revolution, atmospheric carbon dioxide (dark red line) has risen more than 45%, hitting a new record high in 2017 of 405.0 parts per million. Levels go up and down with the seasons, but the long-term trend is clearly upward.
Drought patterns in 2017
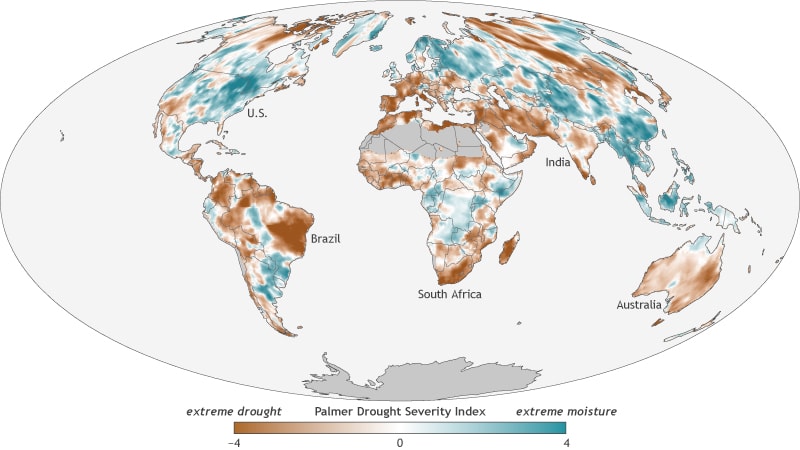
Large areas of severe or extreme drought affected every continent except North America in 2017. Many coastal countries in Africa suffered drought, and an especially severe drought took hold in southwestern India. Globally, drought conditions were less severe in 2017 than 2016, but they were still above average overall.
Drought area over time (1950-2017)
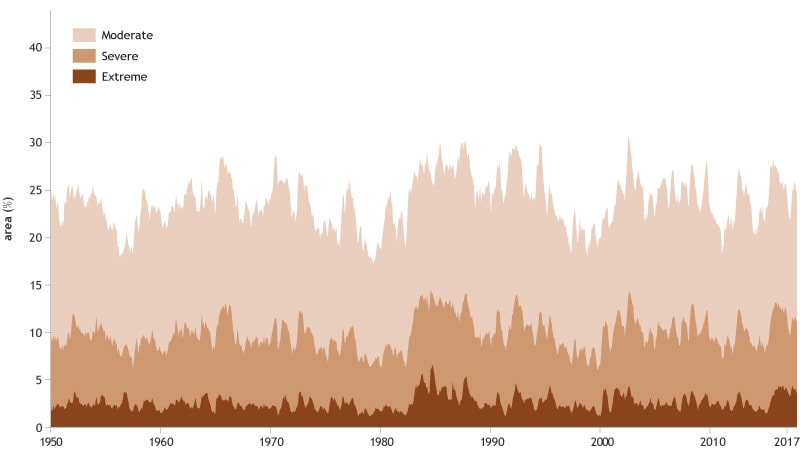
Global-scale drought conditions temporarily improved in early 2017 compared to recent years.
Extreme heat in 2017
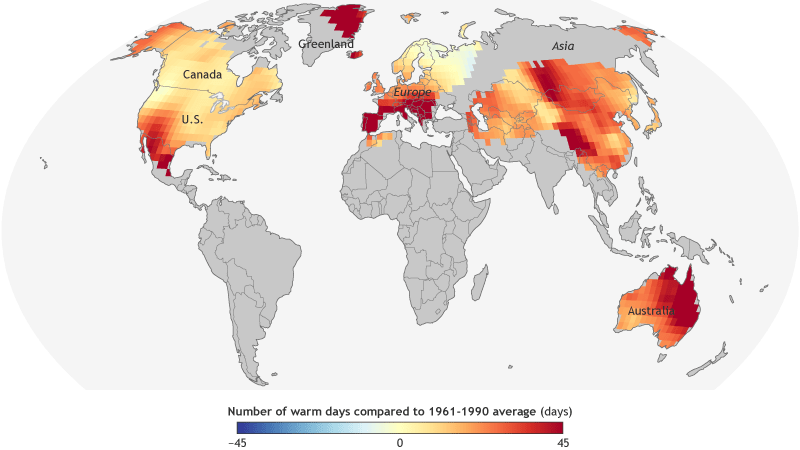
The highest numbers of extremely warm days in 2017 were found across southern Europe, central Asia, and eastern Australia, all of which experienced at least 40 more extremely warm days than their long-term average.
Extreme heat over time (1950-2017)
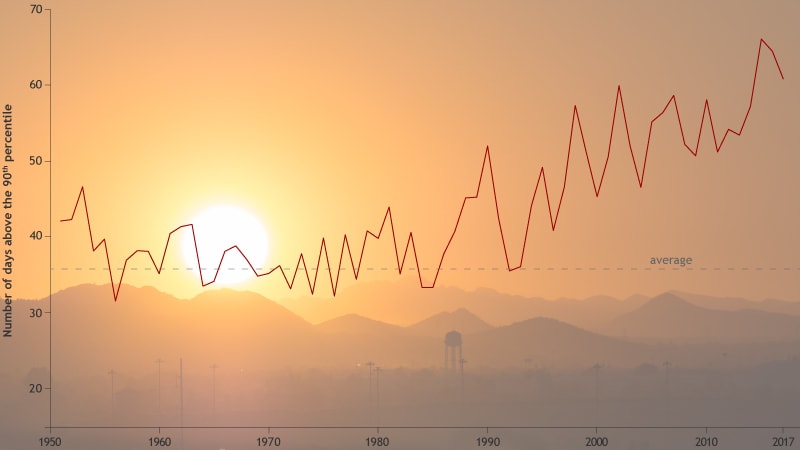
Extreme heat relaxed a bit in 2017 compared to 2016 and 2015, the latter of which holds the record for highest number of hot days. Still, 2017 recorded more than 60 days of extreme daytime heat worldwide, nearly double the 1961-1990 average of 36.5, continuing the long-term trend toward more hot days each year across the globe.