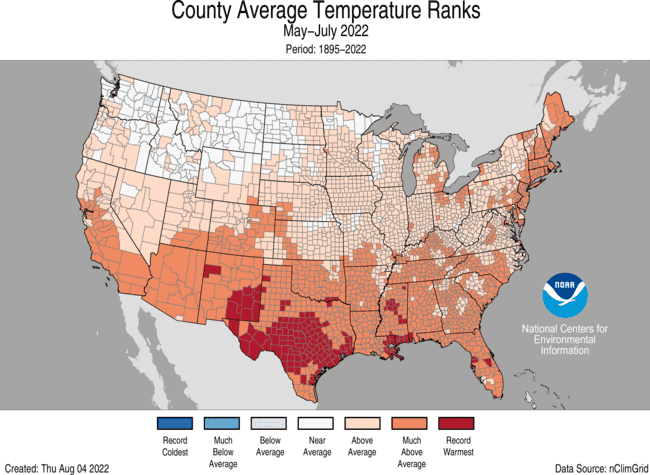
It’s been a scorching summer in much of the US, but no state has sizzled more than Texas. Does this summer’s unusually persistent La Niña bear some of the responsibility for the extreme heat? In this blog post, we’ll try to figure that out!
ENSO impacts on summer US climate: concurrent versus delayed
Back in May of 2015, when the ENSO Blog was still in diapers, Tony Barnston wrote about the expected impacts of El Niño on the US summer climate. Tony’s message about El Niño also holds for La Niña: the summer impacts of La Niña are mostly weak or insignificant in the US. Like El Niño, the impacts of La Niña are stronger in the hemisphere experiencing winter.
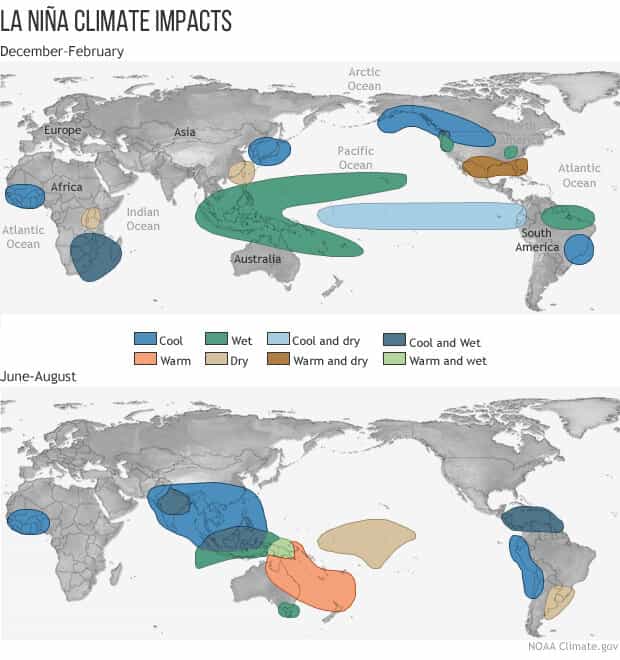
One of the main reasons for the weak U.S. summer influence is the changing of the prevailing winds in summer, including a weaker and more northward-shifted North Pacific jet stream compared to the winter. These changes make it more difficult for ENSOs (ENSO = El Niño-Southern Oscillation, the whole La Niña, and El Niño system) tropical showers and thunderstorms to trigger the cascade of impacts that extend into the US and other Northern Hemisphere locations.
So, is that the end of the story? If yes, what a short and boring blog post this month! Don’t worry, there is more to the story. The preceding discussion focuses on the concurrent impacts of La Niña on the US climate. But what if there also is a delayed impact?
To show you what I mean, the maps below show two ways of looking at the influence of La Niña on early summer (May-July) temperature anomalies in the US. (Usually, anomaly means the difference from the long-term average, but here I’m showing the departure from the trend, so I have removed the effect of long-term warming.) The map on the left shows May-July temperature patterns for years when La Niña was underway over the same period. The map on the right shows the May-July temperature patterns for years when La Niña had occurred the preceding winter (December – February).
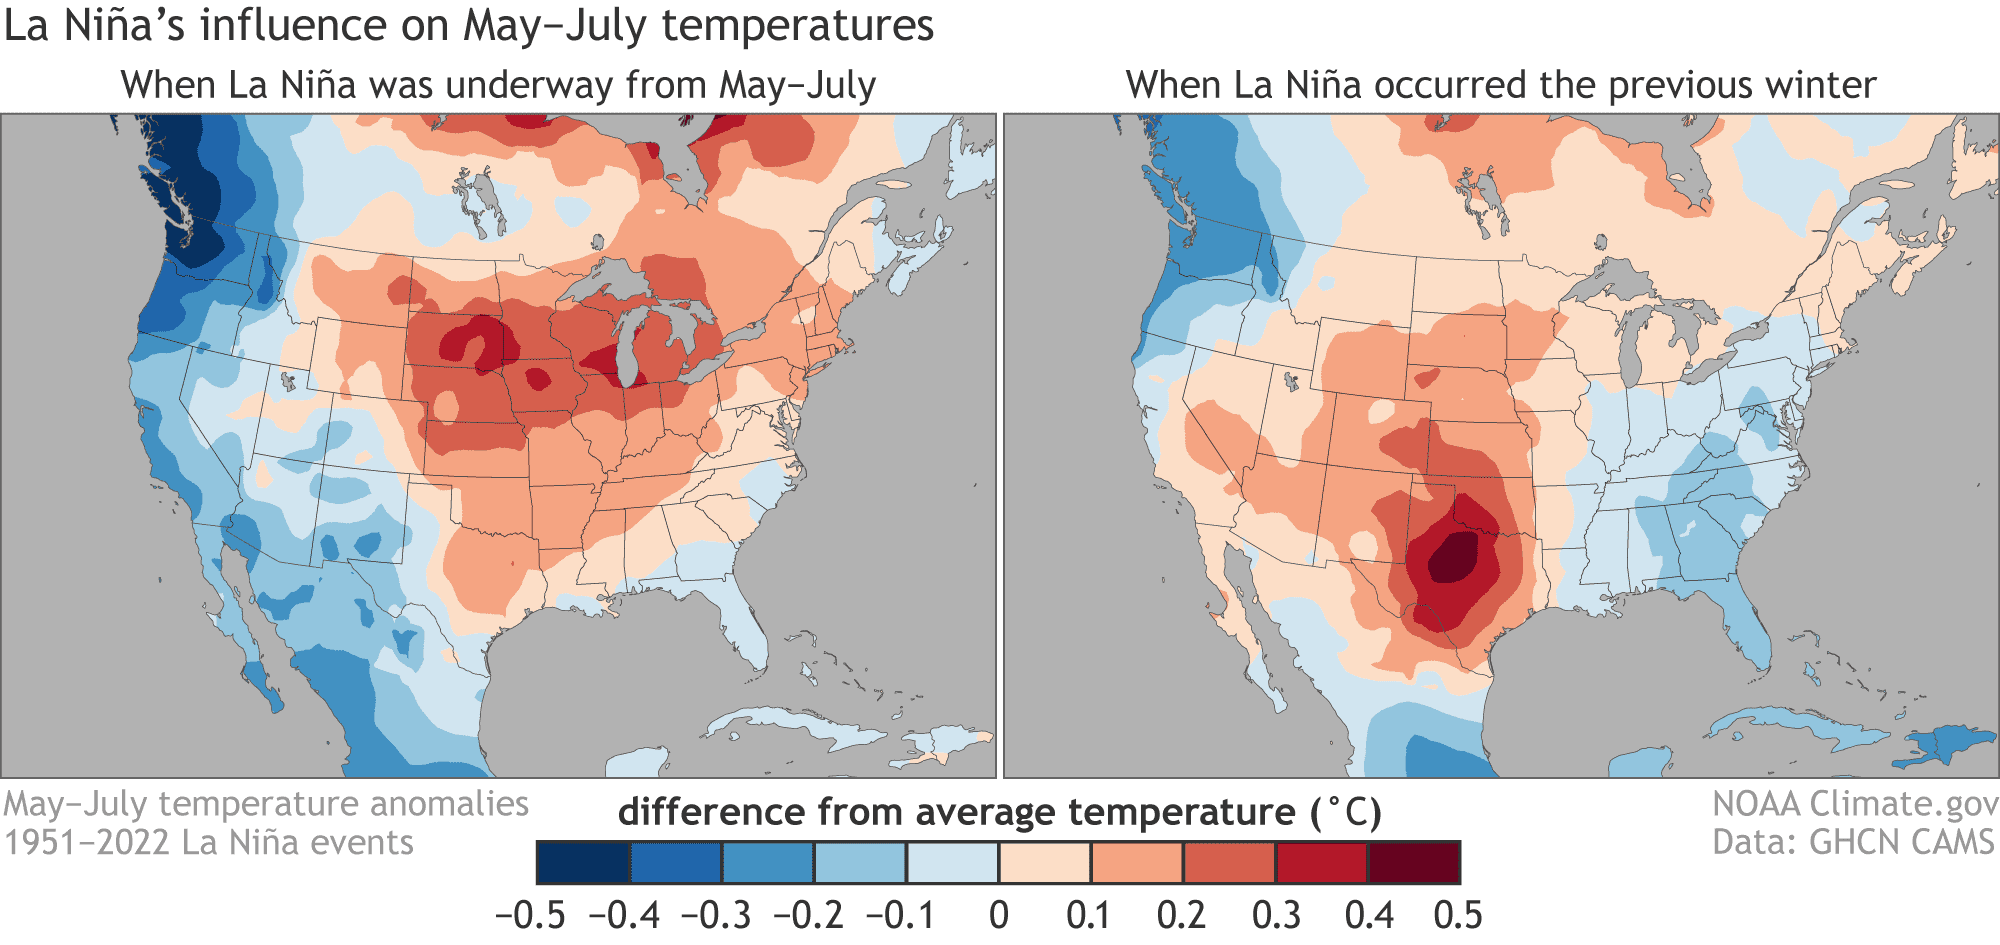
The left map shows that when La Niña is underway from May-July, the central US, especially in the northern High Plains, is a little warmer than average. But the signal is weak, especially in the Texas region which experienced the most extreme heat in 2022. In the right map, on the other hand, we see a much stronger relationship between warmer-than-average Texas early summers and La Niña conditions occurring in the previous winter. That means that Texas summer temperatures have a stronger relationship with previously occurring La Niña conditions than with concurrent conditions! What’s the deal with that?
Don’t underestimate the scrappy land!
The atmospheric processes that connect weather conditions in the tropics to conditions in the higher latitudes, including the US, take shape over a few days to a couple of weeks at most (1), so the reason for a delayed temperature response to La Niña likely isn’t rooted in the atmosphere. A more likely culprit is the land surface, specifically the soil moisture conditions. When the soil is unusually dry in the late spring and summer, incoming sunlight quickly heats up the ground because there is less water to cool the surface through evaporation. The overheated land heats up the atmosphere. Consequently, summer hot extremes in Texas and many other locations around the globe (2) are often preceded by unusually dry soil moisture conditions.

The graph above helps us to put the puzzle pieces together. The dots show the relationship between cool-season precipitation in Texas for each year from 1951–2022 (horizontal axis) and the early summer temperatures (vertical axis). The farther right a dot is, the wetter the winter was; the farther left, the drier it was. The higher a dot is, the hotter the summer was, and the lower a dot is, the cooler it was. Blue dots are years when La Niña was underway in December-February.
Two important features in this plot stand out: (1) La Niña winters tend to bring dry winters and springs to Texas (more blue dots on the left of the graph than on the right), consistent with what we know about La Niña’s effect on US winter climate and (2) dry winters and springs tend to bring warmer-than-average summers (on the left side of the graph, there are more dots near the top than the bottom), consistent with the soil moisture effects described above (3). This summer met both criteria, with a persistent La Niña and very dry conditions in the winter and spring. So, one of the main reasons for La Niña’s delayed effects on Texas summer temperatures likely relates to the reduced winter-spring rainfall and the resulting soil moisture deficits that lead to increased heating in summer.
But just one piece of the puzzle
It’s important to keep in mind that the typical influence of La Niña, which is the focus here, is just a small fraction of the Texas temperature anomaly that occurred this year. In the Texas region I focus on in the above plot, the May – July temperature in 2022 was about 2.1 °Celsius (3.8 ° F) above the 1991-2020 average. The average influence of the preceding La Niña conditions is only about 0.3 °C (0.5 ° F), so a big part of the extreme heat that occurred this year must also relate to other factors, which could include global warming due to increasing greenhouse gases, the particular details of this year’s sea surface temperature evolution in the tropical Pacific and elsewhere around the globe (4), and random weather variability. Nevertheless, a La Niña winter is likely a consistent factor in many of the hottest Texas summers (5).
This example is a reminder that the impacts of ENSO on our climate are not always immediate, especially in the summer. Snapshots of the tropical Pacific climate are useful, but consideration of its evolution in time is even more valuable.
Footnotes
- The main exception to this rule is processes that involve interaction between the troposphere and stratosphere, which could take a couple of months, but these do not occur during the summer season.
- Other regions strongly influenced by soil moisture deficits include the Intermountain West, parts of the eastern US, much of South America, Southern and Eastern Europe, Australia, China, Japan, and the southern tip of Africa. Check out this study to learn more.
- For those of you who are sticklers of statistical rigor, the Pearson correlation coefficient between the Texas December – April detrended precipitation anomalies and the May – July detrended temperature anomalies shown in the scatter plot is -0.39. This confirms a statistically significant connection relationship between Texas winter-spring precipitation and early summer temperature according to standard measures of statistical significance.
- One way that climate scientists attempt to get a more complete picture of how sea surface conditions influenced the climate is by running climate models that isolate the effects of observed global sea surface temperature and possibly sea ice anomalies. These simulations are frequently called “AMIP” simulations, in reference to the Atmospheric Model Intercomparison Project. The scientists often run many different simulations with identical sea surface conditions but with slightly perturbed atmospheric initial conditions, like with standard weather or seasonal climate forecasts, so that the average of all simulations washes out the noise of chaotic weather variability and isolates the impact of the sea surface conditions on the climate.
The NOAA Climate Prediction Center routinely runs these sorts of AMIP simulations as part of their near real-time attribution of seasonal climate anomalies. For example, if you check out slide 16 of their May – July 2022 attribution, you will see a figure on the top right that shows the results of their AMIP simulations. This figure seems to indicate a temperature pattern like the pattern I show in this post but stronger in amplitude. This would suggest that the effects of the sea surface temperature anomalies this year may have been stronger than the typical or averaged La Niña effects illustrated in this post.
If you are interested in the attribution of recent seasonal climate anomalies, then that CPC website is one of the Internet’s hidden gems!
- For example, this study examined the 10 most severe extreme heat waves in Texas since 1979 and found that 8 out of 10 were preceded by conditions consistent with La Niña, that is, anomalously cold conditions in the central and eastern equatorial Pacific.
This post first appeared on the climate.gov ENSO blog and was written by Nat Johnson.