Happy new year! This La Niña event is likely near peak strength as we start 2022. Related impacts to global weather and climate will continue through the rest of winter and into the spring, however, because climate impacts lag tropical Pacific sea surface temperature changes. Forecasters favor a transition to neutral in the April–June period.
Chutes and Ladders
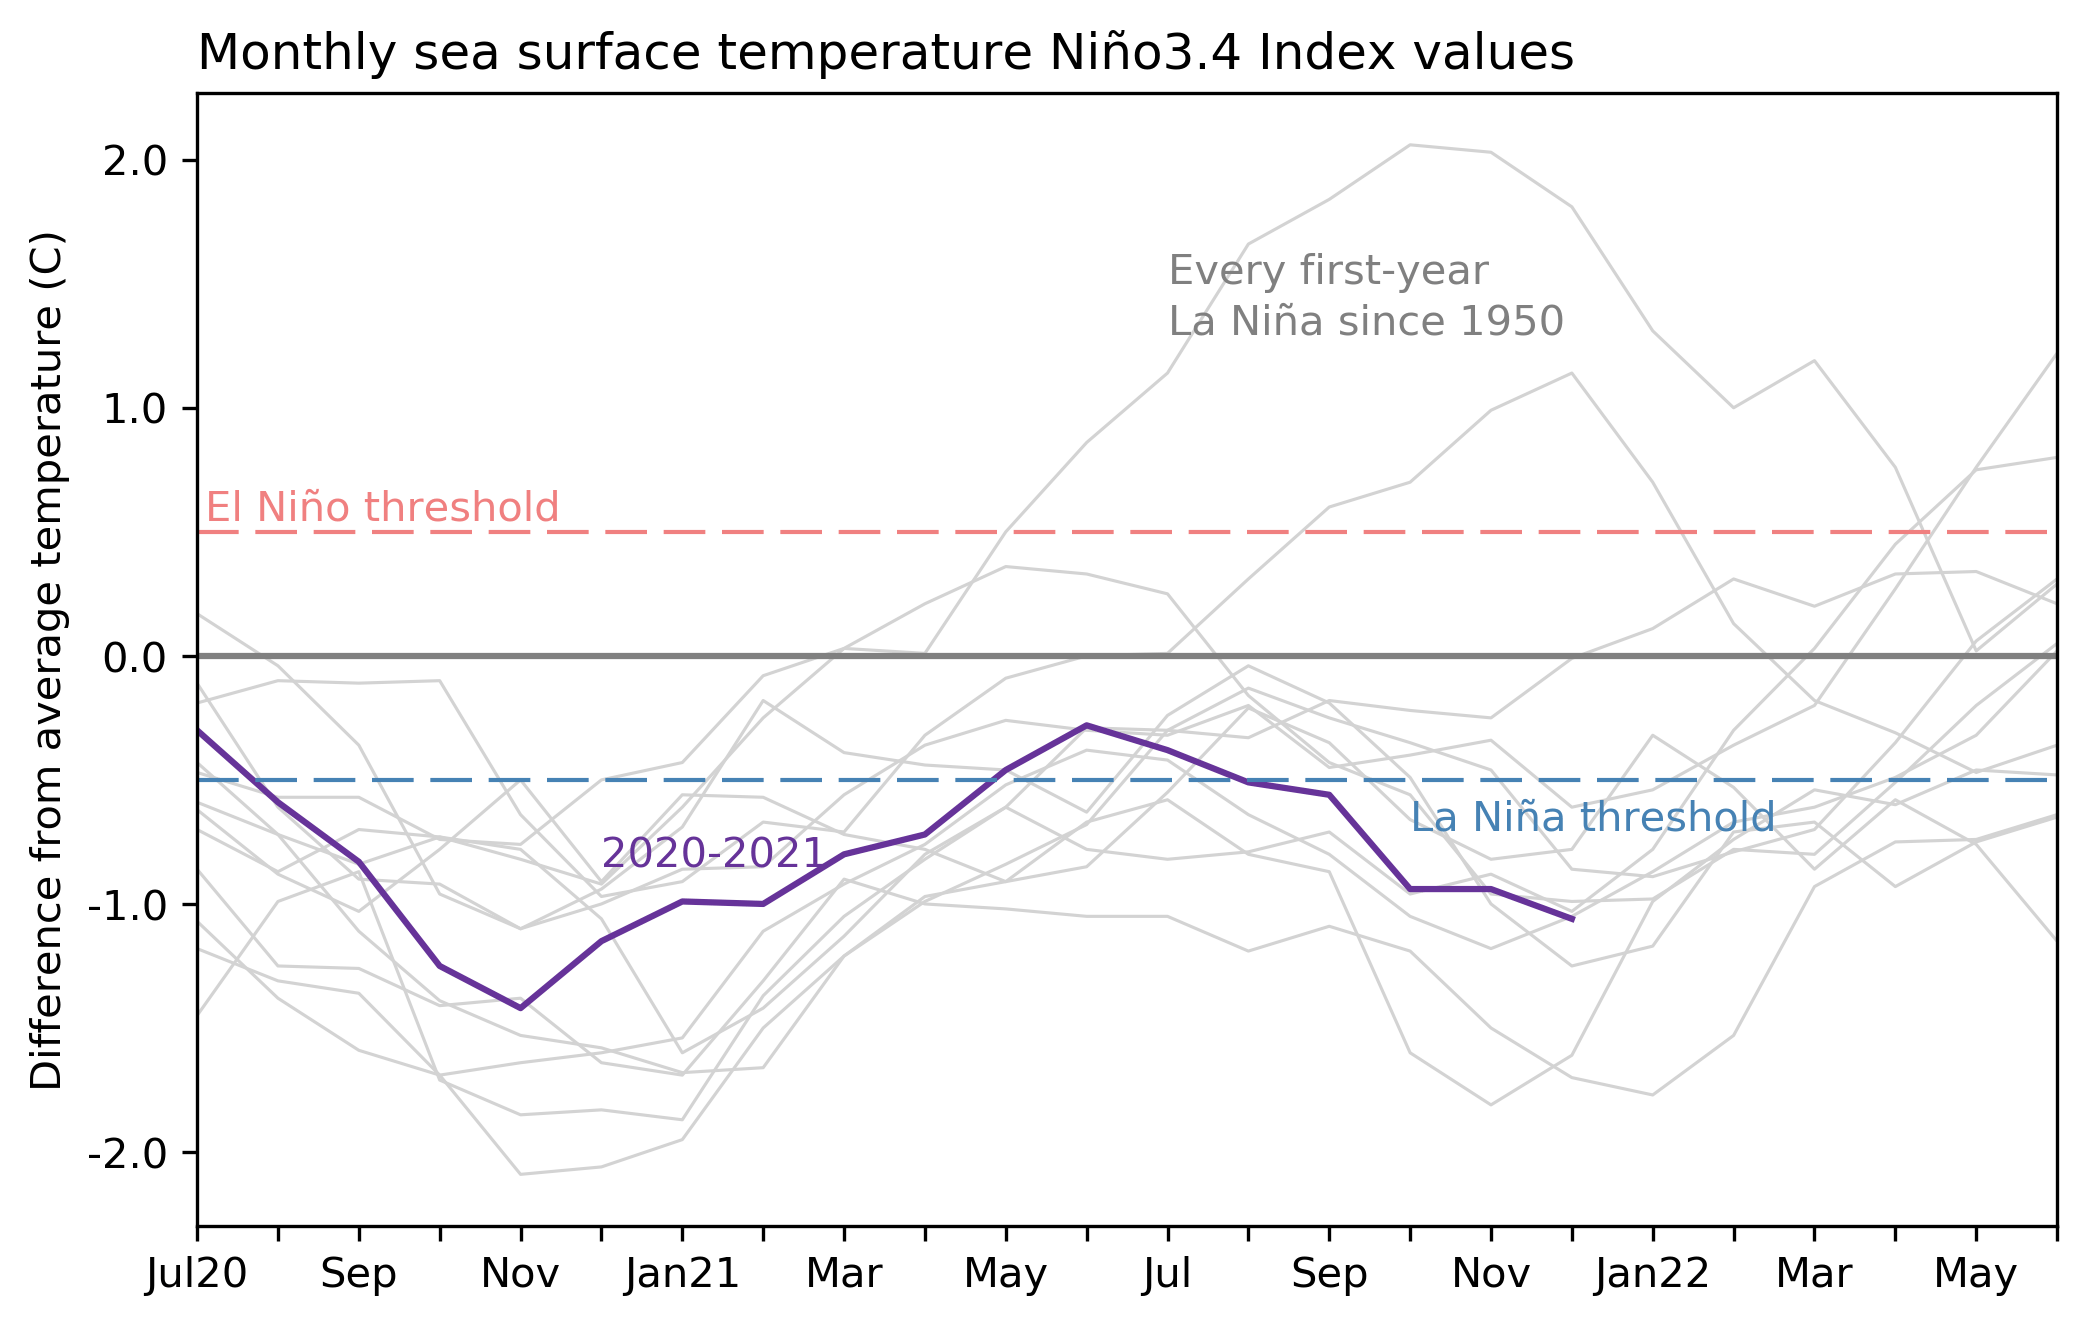
The sea surface temperature in the Niño-3.4 region of the tropical Pacific—our primary measurement of the El Niño/Southern Oscillation (ENSO) system—was 1.1° C cooler than the 1991–2020 average in December, via the ERSSTv5 observation dataset.
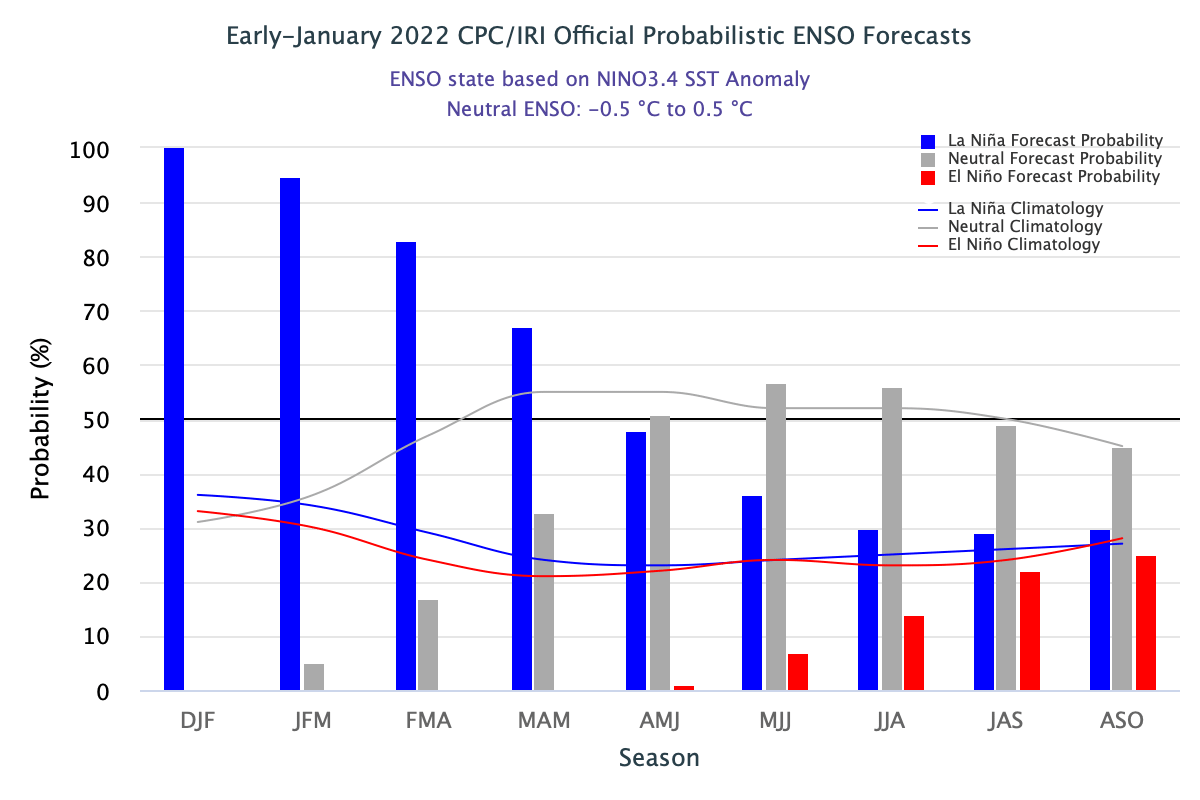
The three-month temperature deviation from average in Niño-3.4, the Oceanic Niño Index, for October–December was -1.0° C. This marks the fourth three-month period (“season” in climate prediction parlance) in a row with an index more than 0.5° C cooler than the long-term average. It takes five seasons in a row to qualify as an official El Niño or La Niña event and get colored red or blue in the historical events table. It’s certain that this event will qualify—forecasters give the December–February period a 100% chance of being in La Niña territory, and 95% likelihood for January–March.
Why five seasons? Because, when they needed to come up with an official ENSO definition, an international committee of ENSO experts argued that we need equatorial Pacific sea surface temperature anomalies to persist for this duration in order to ensure that the atmosphere and ocean in the ENSO system are truly coupled (supported by a variety of atmospheric and ocean indexes). A persistent, coupled tropical Pacific also makes it more likely that ENSO can modify global weather and climate patterns too.
Atmospheric conditions in the tropical Pacific region also reflected La Niña in December, with evidence of a strengthened Walker circulation. La Niña’s cooler-than-average central/eastern equatorial Pacific enhances the normal warm-west/cool-east temperature gradient, so the atmospheric response is an enhanced version of the normal circulation pattern. This means more rising air and clouds in the west, stronger west-to-east upper-level winds, drier conditions in the central Pacific, and stronger trade winds near the surface, all of which were clocked during December. The links here lead to the International Research Institute for Climate and Society’s Maproom, where you can select the month and the level in the atmosphere.
The Game of Life
So La Niña will stick around for the next few months, but what about next summer/fall? Even though we would really like to know, especially given ENSO’s effect on tropical storms, this is still really unclear. As I discussed last month, a third-year La Niña, neutral, or El Niño are all still on the table. Computer models, including those from the North American Multi-Model Ensemble, show a broad range of potential outcomes for the fall, too.
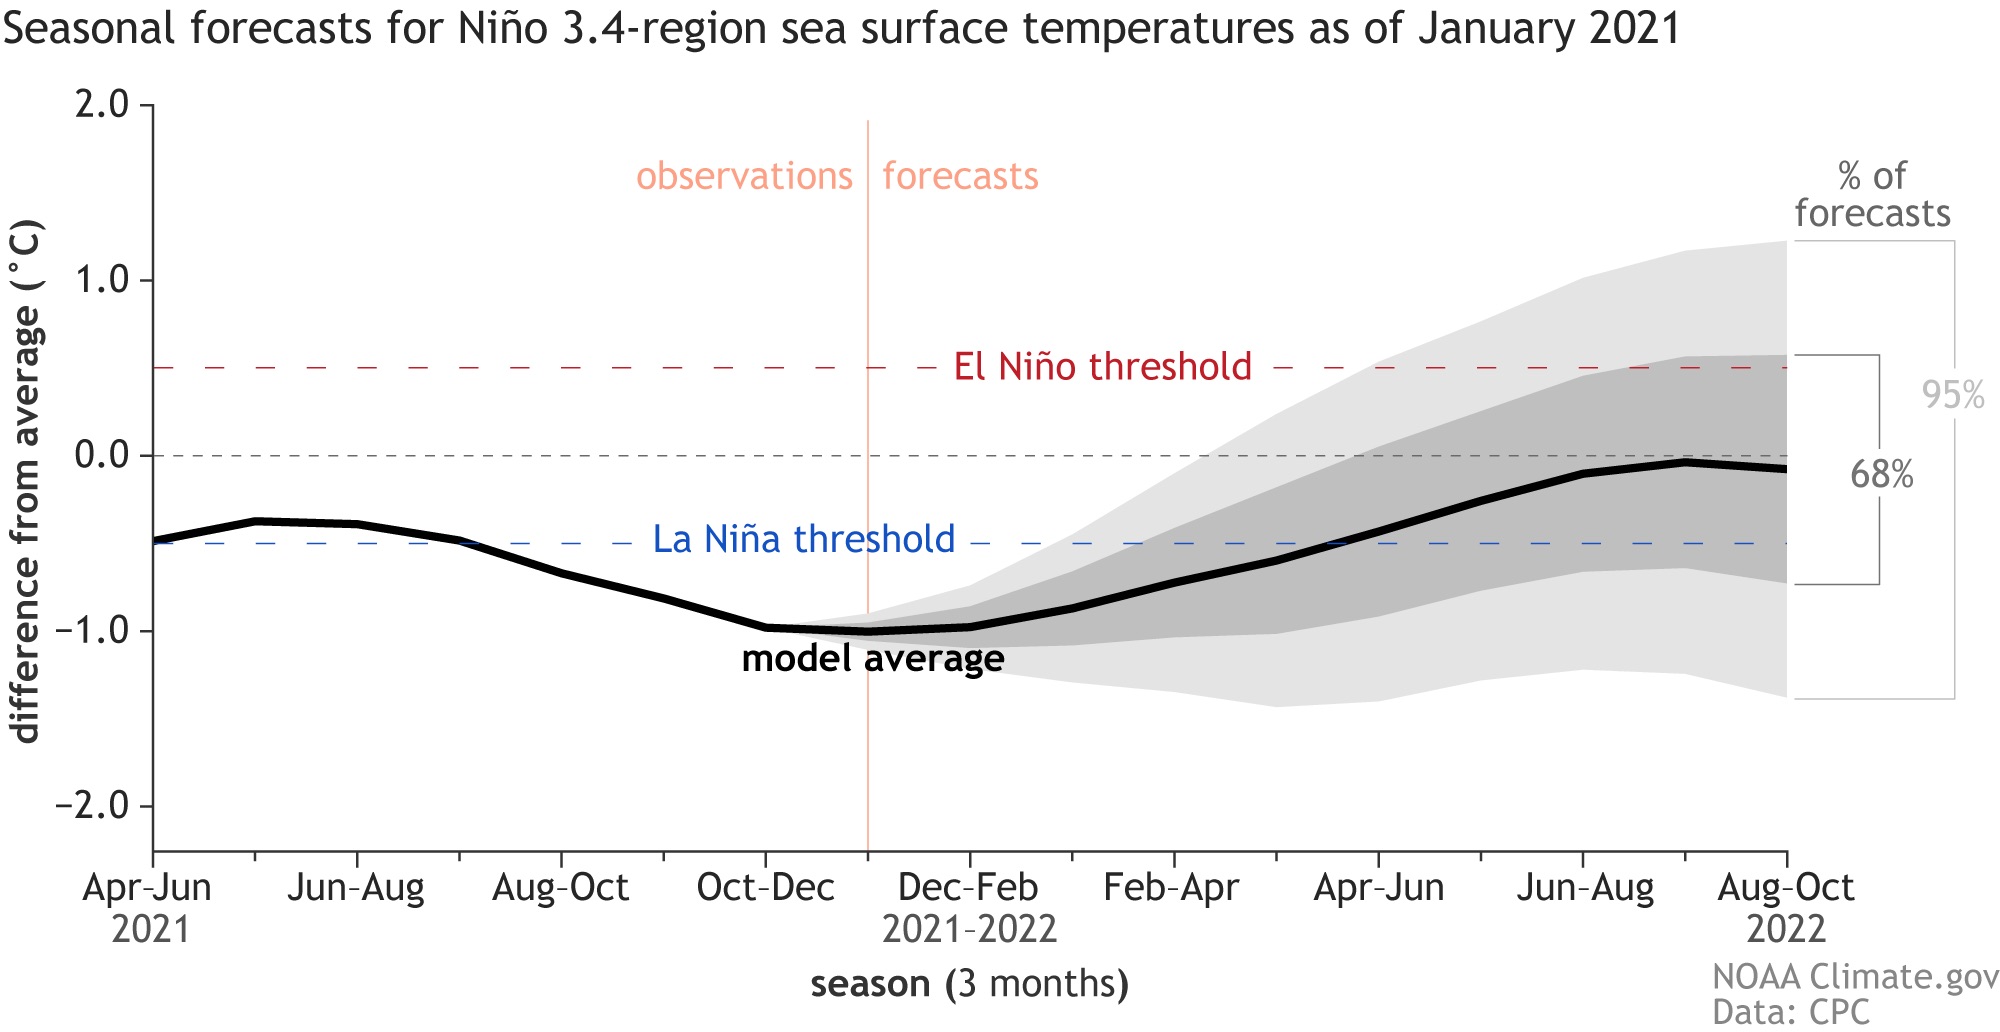
We’ll have to play a few more rounds to get a clearer picture of how the tropical Pacific will set up for later this year.
Trivial Pursuit
This La Niña’s effect on rain and snow patterns in North America has been pretty typical so far, with drier conditions through the south-central and southeastern U.S. and wetter over the Pacific Northwest, northern California, and the Ohio Valley over the past three months. The excess precipitation in Washington State has been in the news lately, making me curious about how this year fit into the historical context. More precipitation in the Pacific Northwest, especially more snow, is one of the more consistent La Niña impacts, as the jet stream tends to get deflected northward, bringing more storms with it.
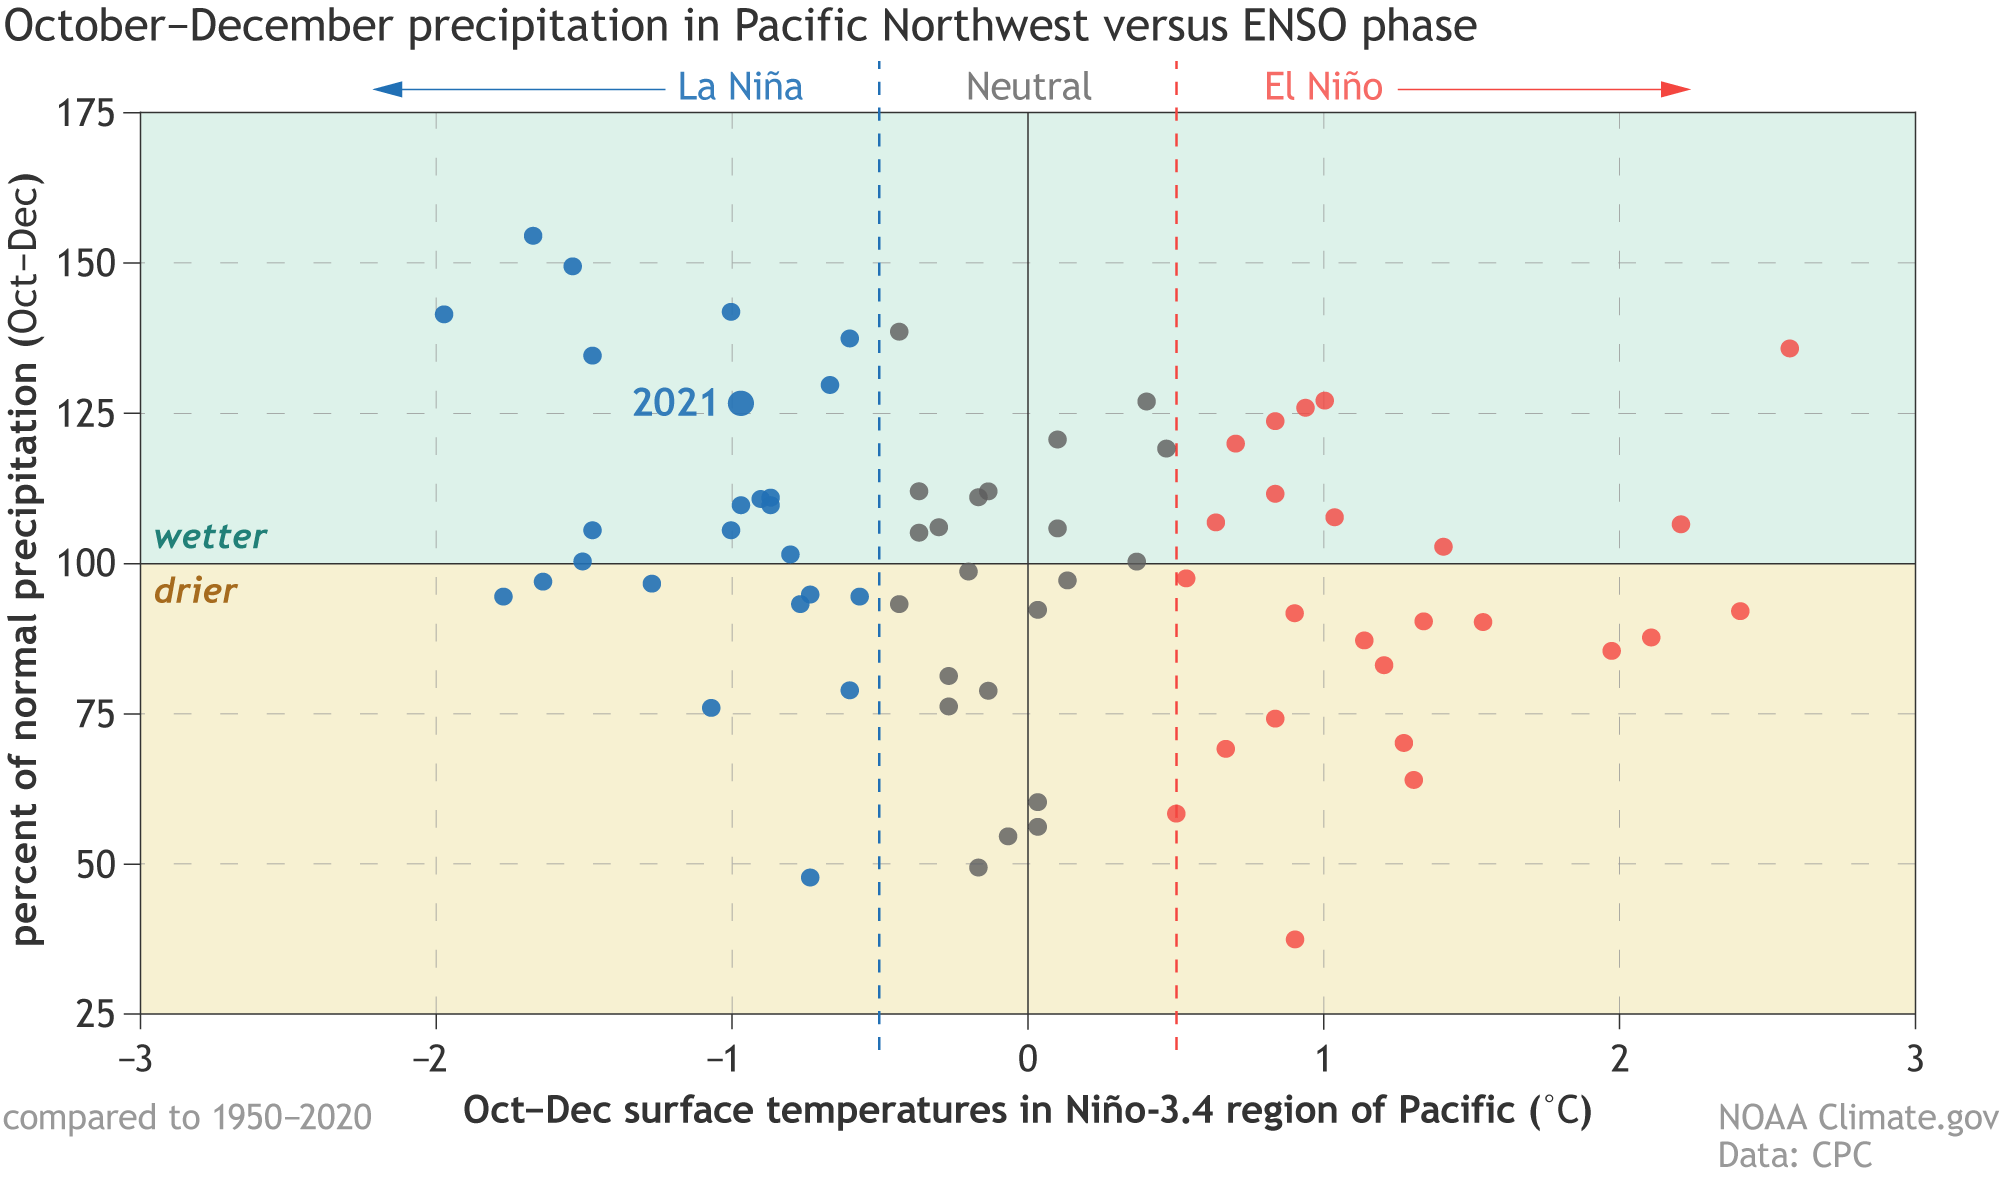
Winters with more precipitation (I’m combining rain and snow here, with snow measured as rain-equivalent) tend to occur during La Niña, and drier winters during El Niño, although of course there are exceptions! La Niña 2021–22, a borderline moderate event so far, fits the pattern, with about 125% of average precipitation in October–December. The Pacific Northwest also has a climate-change related trend toward wetter conditions in the fall and winter. You can look at the trend and La Niña impacts side-by-side here.
Yahtzee
Speaking of the jet stream, stay tuned to the ENSO Blog for a special guest post on this topic later this month! And, of course, your trusty regular correspondents will be here to keep you updated on the forecast and all things ENSO.
This post first appeared on the climate.gov ENSO blog and was written by Emily Becker.