How is the September Climate Changing in the US?
A post originally on the NOAA website, written by Rebecca Lindsey
Climate scientists are often asked how global warming can be real if every spot on Earth isn’t warming in every season. The simple answer is just math. It doesn’t have to be warming everywhere: the warming just has to overpower the cooling. (The answer to why different places and seasons warm at different rates is, as you’d expect, a bit more complicated.)
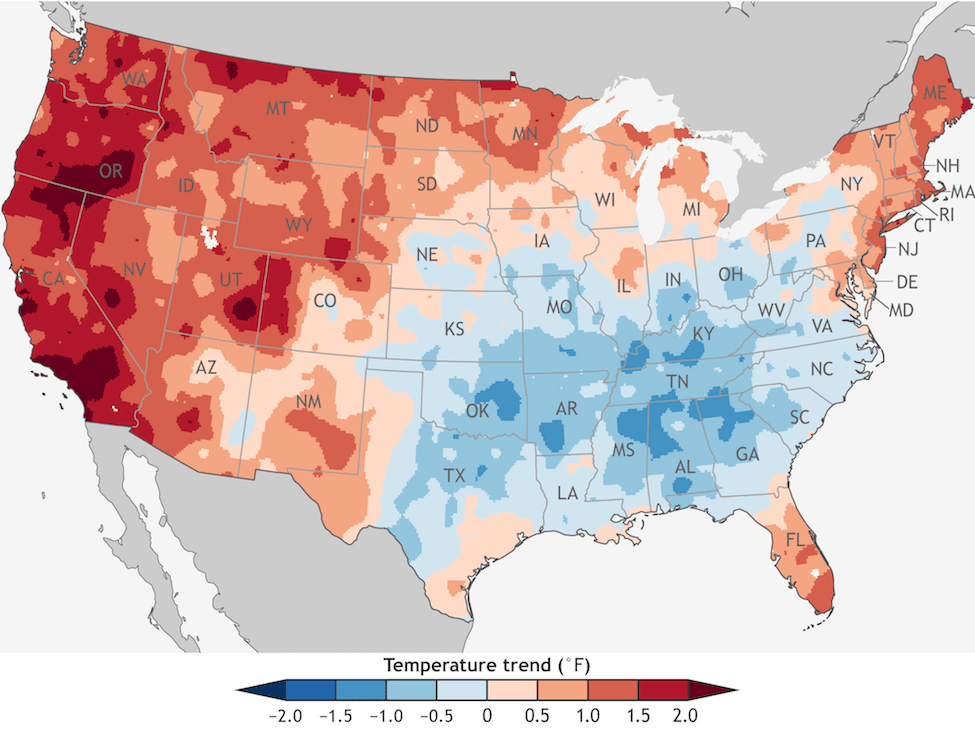
The above map of temperature change in September in the contiguous United States is an example of this mathematical reality. (Alaska isn’t included because its data record doesn’t go all the way back to the nineteenth century). Over the years from 1895–2017, much of the western United States has warmed more than 1 degree Fahrenheit in September (orange and red colors dominate west of the Rockies.) Meanwhile, much of the Southern Plains, Mississippi Valley, and the Deep South have cooled. The cooling in the East is likely the result of another September trend: more precipitation.
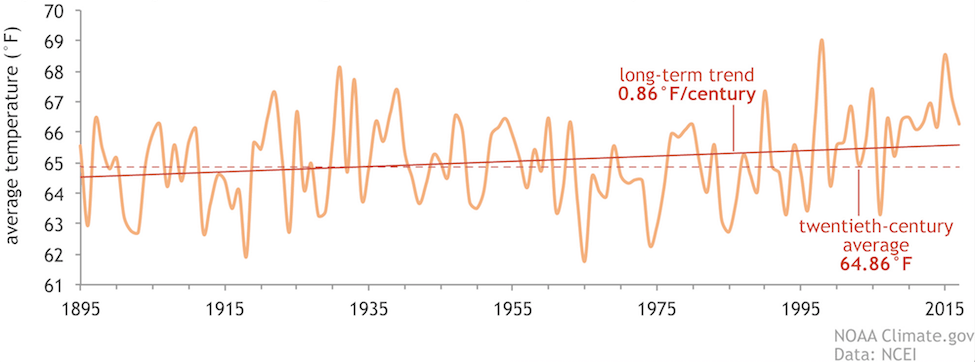
The graph shows how this September warming and cooling balance out. The light orange line shows the U.S. temperature each September from the start of the historical record in 1895 through the end of 2017. The dashed line shows the twentieth-century average temperature, and the dark red line shows the long-term trend.
When we average over the whole country, the magnitude and footprint (total area) of the warming out West and in the Northeast combine to outweigh the cooling in the South, so the overall trend in U.S. temperatures in September is slightly upward—0.86 degrees Fahrenheit per century. When we average over all months of fall (September-November), the U.S. warming trend increases to 1.16 degrees F per decade. When we examine data over a whole year, it rises to 1.51 degrees F per century.
This map is based on analysis by NOAA’s National Centers for Environmental Information, part of its National Climate Trends map collection. For each month and season of the year, the center produces maps showing the long-term and recent (30-year) temperature and precipitation trends for all areas of the contiguous United States, as well as complementary maps that show the areas where the statistical confidence in the trends is highest. The graph is based on data from NCEI’s Climate at a Glance tool.
If you’d like to preview how warm September may get in coming decades depending on the sorts of energy choices humans make now and in the future, check out the Climate Projections section of our Data Snapshots map collection.