This is great news for snow lovers in the US of A. NOAA is claiming that the hottest days of year are most likely behind us at this point. Hallelujah!
The exception being places on the Pacific Coast like San Francisco who usually have their hottest days on October. But, people on the coast love these days because summer on the Pacific Coast can be a foggy nightmare.
For those of us in mountain towns, the hottest days of the year are behind us. Bring on the snow!
***
The heat is…off. For most of the U.S., the warmest day of the year has probably passed
by NOAA
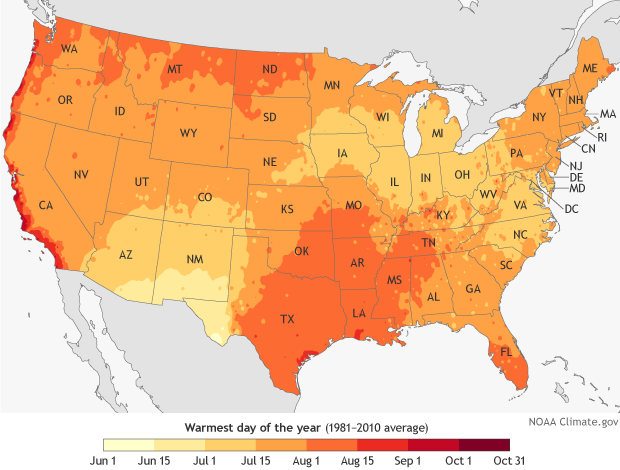
For most of us in the United States, the highest temperatures of the year occur between July and August, meaning that, statistically speaking, the worst of the heat is likely already behind most of us. The major exception is the Pacific coastline, where the warmest day typically occurs during the month of September. A very few holdouts—including San Francisco and places on Hawaii’s Big Island (larger map includes Hawaii, Puerto Rico, and Alaska)—don’t experience their warmest day until October!
This map shows average day of the year with the highest maximum temperature based on the 1981-2010 U.S. Climate Normals, the nation’s official record of recent climate. The colors show date ranges progressing from June 1 (lightest yellow) through September 30 (darkest red). The darker the color, the later in the year the warmest day typically arrives.
For most of the country, the warmest day occurs sometime between mid-July and mid-August. The amount of solar radiation reaching Earth (in the northern Hemisphere) peaks at the summer solstice on June 21, but temperatures tend to keep increasing into July. The continued warming occurs because the rate of heat input from the sun during the day continues to be greater than the cooling at night for several weeks past the solstice, until temperatures start to descend in late July and early August.
The lightest and darkest areas of the map show just how variable the U.S. climate can be. The lightest colors (earliest warmest day) occur in New Mexico and Arizona. This early arrival reflects the influence of the North American Monsoon, a period of increased rainfall affecting the U.S. Southwest in mid-to-late summer. The region’s highest temperatures tend to occur in June, before the monsoon’s clouds and rain set in.
The darkest colors occur along the Pacific coastline, where the persistence of the marine layer—a persistent layer of clouds that forms above the chilly coastal waters—maintains cool temperatures in early summer. In many locations, the warmest days on average do not occur until September when the fog lifts. While the map shows warmest days of the year on average throughout the United States, this year’s actual conditions may vary widely based on short-term weather and climate patterns.
The National Centers for Environmental Information (NCEI) Warmest Day of the Year” maps are derived from the 1981–2010 U.S. Climate Normals, 30-year averages of climatological variables including the average high temperature for every day.
Temperature normals are important indicators that are used in forecasting and monitoring by many U.S. economic sectors. Knowing the probability of high temperatures can help energy companies prepare for rising electricity demand and help farmers monitor heat-sensitive crops. They are also useful planning tools for the healthcare, construction, and tourism industries. You may even want to check the normals at your destination before planning your next event or vacation.
NOAA Climate.gov image, adapted from original by the National Centers for Environmental Information, based on the 1981–2010 U.S. Climate Normals.