
NOAA first called for La Nina this Fall/Winter for North America last spring.
They issued a La Nina Watch, said La Nina had a 75% chance of happening, then they canceled the La Nina Watch on September 8th, 2016 and said that La Nina wasn’t favored to happen.
Then, they brought back La Nina on October 13th, 2016 saying it had a 70% chance of happening.
Now, NOAA is saying that there is only a 55% chance of La Nina happening this 2016/17 fall/winter and they’ve dropped the La Nina forecast from a La Nina Watch to a La Nina Advisory.
La Nina essentially has a 50/50 chance of happening this fall/winter… Those aren’t great odds.
“Synopsis: La Niña conditions are present and slightly favored to persist (~55% chance) through winter 2016-17.” – NOAA, November 10th, 2016

Bottom line: Don’t get too excited for La Nina nor its effects this winter season.
Below you’ll find NOAA’s latest La Nina blog (layman) and NOAA’s official La Nina update below that. Both were published on November 10th, 2016.

November 2016 La Niña update: Hello, lady!
Let’s take a tour through the La Niña diagnostic flowchart…

Flowchart showing decision process for determining La Niña conditions. Figure by Fiona Martin, adapted by Climate.gov.
Is the sea surface temperature in the Niño3.4 region more than half a degree cooler than average? Yes! (It was about -0.7°C below average during October.) Do forecasters think it will stay cooler than that threshold for several overlapping three-month periods? Yes! (But just barely.) Finally, are there signs that the atmospheric circulation above the tropical Pacific is stronger than average? Yes! This all means that La Niña has officially arrived.
First things first
The Niño3.4 Index—the temperature of the ocean surface in a specific region of the equatorial Pacific, and our primary metric for measuring El Niño and La Niña—has been trending cooler since the demise of our big El Niño event in May. We now have two consecutive overlapping “seasons” (in climate forecaster lingo, that’s any three-month period) where the Nino3.4 Index averaged more than -0.5°C cooler than the long-term average: July—September and August—October.
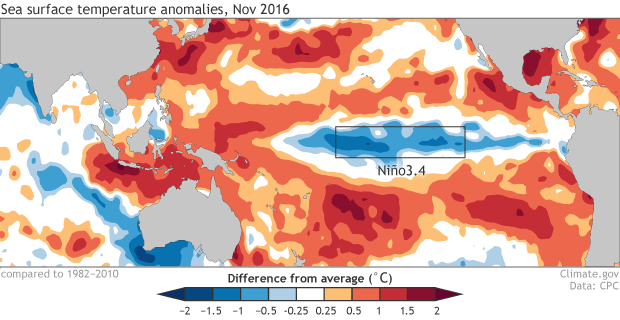
One of the interesting things about this sea surface temperature map is just how warm the rest of the world’s oceans are, even compared to recent La Niña years like October 2011 or October 2007. Visit NOAA’s Visualization Lab to look at earlier years. (But be warned—there’s a lot of fun stuff to look at over there!)
Next step
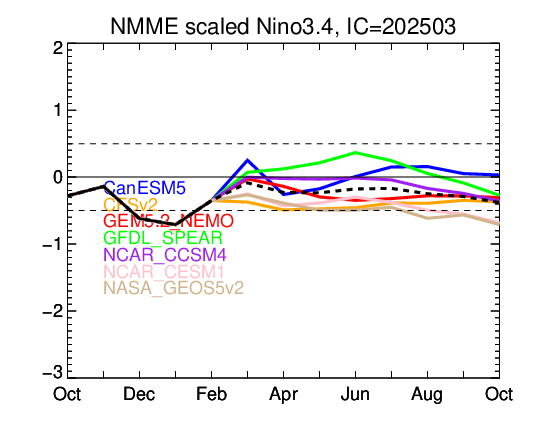
The current NOAA Climate Prediction Center/IRI forecast gives La Niña conditions a slight edge through mid-winter: about a 55% chance. In order to qualify as a La Niña episode, La Niña conditions have to be present for at least five consecutive overlapping seasons, but of course we can’t know for sure in advance that that will happen. So, in order to qualify as La Niña conditions, we require a forecast that favors that they’ll remain for several months.
A 55% chance isn’t overwhelming, but not much about this La Niña is right now. Almost all of the computer models predict that the Niño3.4 Index will hover just below -0.5°C cooler than average for a few months, before returning to near-average in the late winter.
The final piece
The whole reason that ENSO (El Niño/Southern Oscillation) matters to countries located far from the tropical Pacific is the changes it causes to global atmospheric circulation. Therefore, we can’t have La Niña conditions without some specific changes in atmospheric circulation. There are several of these changes we look for, all related to the Walker Circulation over the tropical Pacific.
La Niña’s cooler surface waters lead to less rising air, and therefore fewer clouds than average in the central Pacific. Conversely, there is more rising air, clouds, and rain over Indonesia during La Niña. This part of the atmospheric response to La Niña has been pretty clear over the past couple of months.
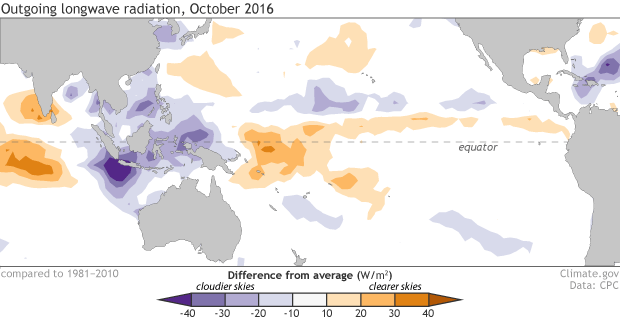
Places that were more (purple) or less (orange) cloudy in October 2016 than the 1981-2010 average based on satellite observations of outgoing longwave radiation (heat). Thick clouds block heat from radiating out to space, so less radiation = more clouds, and more radiation = clearer skies. Climate.gov map from CPC data.
We’ve also seen stronger-than-average easterly (blowing from east to west) winds in the central Pacific, more evidence that the Walker Circulation is strengthened. However, while this has been fairly consistent since mid-September, these winds are definitely not blowing us away!
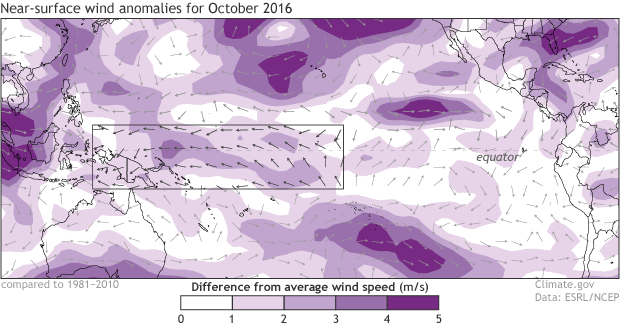
Average near-surface winds during October 2016 compared to the 1981-2010 average. The winds along the equator usually blow east-to-west (the trade winds); arrows in the marked box shows the enhanced trades. Climate.gov figure from NCEP/NCAR data provided by NOAA ESRL.
The atmospheric response overall is fairly weak, going along with the borderline cooler sea surface temperatures of this La Niña… but it’s been consistent for a few months, meaning that we are seeing a change on seasonal timescales, and it’s time to formally welcome La Niña conditions! Be sure to check out Mike’s post to see what forecasters think La Niña means for U.S. winter weather.
***
***
EL NIÑO/SOUTHERN OSCILLATION (ENSO) DIAGNOSTIC DISCUSSION
issued by
CLIMATE PREDICTION CENTER/NCEP/NWS
and the International Research Institute for Climate and Society 10 November 2016
ENSO Alert System Status: La Niña Advisory
Synopsis: La Niña conditions are present and slightly favored to persist (~55% chance) through winter 2016-17.
La Niña conditions were observed during October, with negative sea surface temperature (SST) anomalies in early November stretching across most of the eastern and central equatorial Pacific Ocean (Fig. 1). With the exception of the Niño1+2 region, the Niño region indices remained negative over the last month, with the latest weekly value of the Niño-3.4 index at -0.8°C (Fig. 2). The upper-ocean heat content also remained below average during October (Fig. 3), reflecting below-average temperatures at depth (Fig. 4). Convection was suppressed over the central tropical Pacific and enhanced over Indonesia (Fig. 5). The lower-level easterly winds were weakly enhanced near and west of the International Date Line, and anomalously westerly upper-level winds were mainly west of the International Date Line. Overall, the ocean and atmosphere system reflected weak La Niña conditions.
The multi-model averages favor La Niña conditions (3-month average Niño-3.4 index less than or equal to -0.5°C) continuing through the winter (Figs. 6 and 7). Given the current atmospheric and oceanic conditions, along with model forecasts, the forecaster consensus favors the continuation of weak La Niña conditions through December-February (DJF) 2016-17. At this time, the consensus favors La Niña to be short-lived,withENSO-neutralfavoredbeyondDJF. LaNiñaconditionsarepresentandslightlyfavored to persist (~55% chance) through winter 2016-17 (click CPC/IRI consensus forecast for the chance of each outcome for each 3-month period).
La Niña is likely to affect temperature and precipitation across the United States during the upcoming months (the 3-month seasonal outlook will be updated on Thursday November 17th). Seasonal outlooks generally favor above-average temperatures and below-median precipitation across the southern tier of the United States, and below-average temperatures and above-median precipitation in the northern tier of the United States.


